Chapter 9 Lifesheets: End-User Development of Quantified Self Applications
Contents
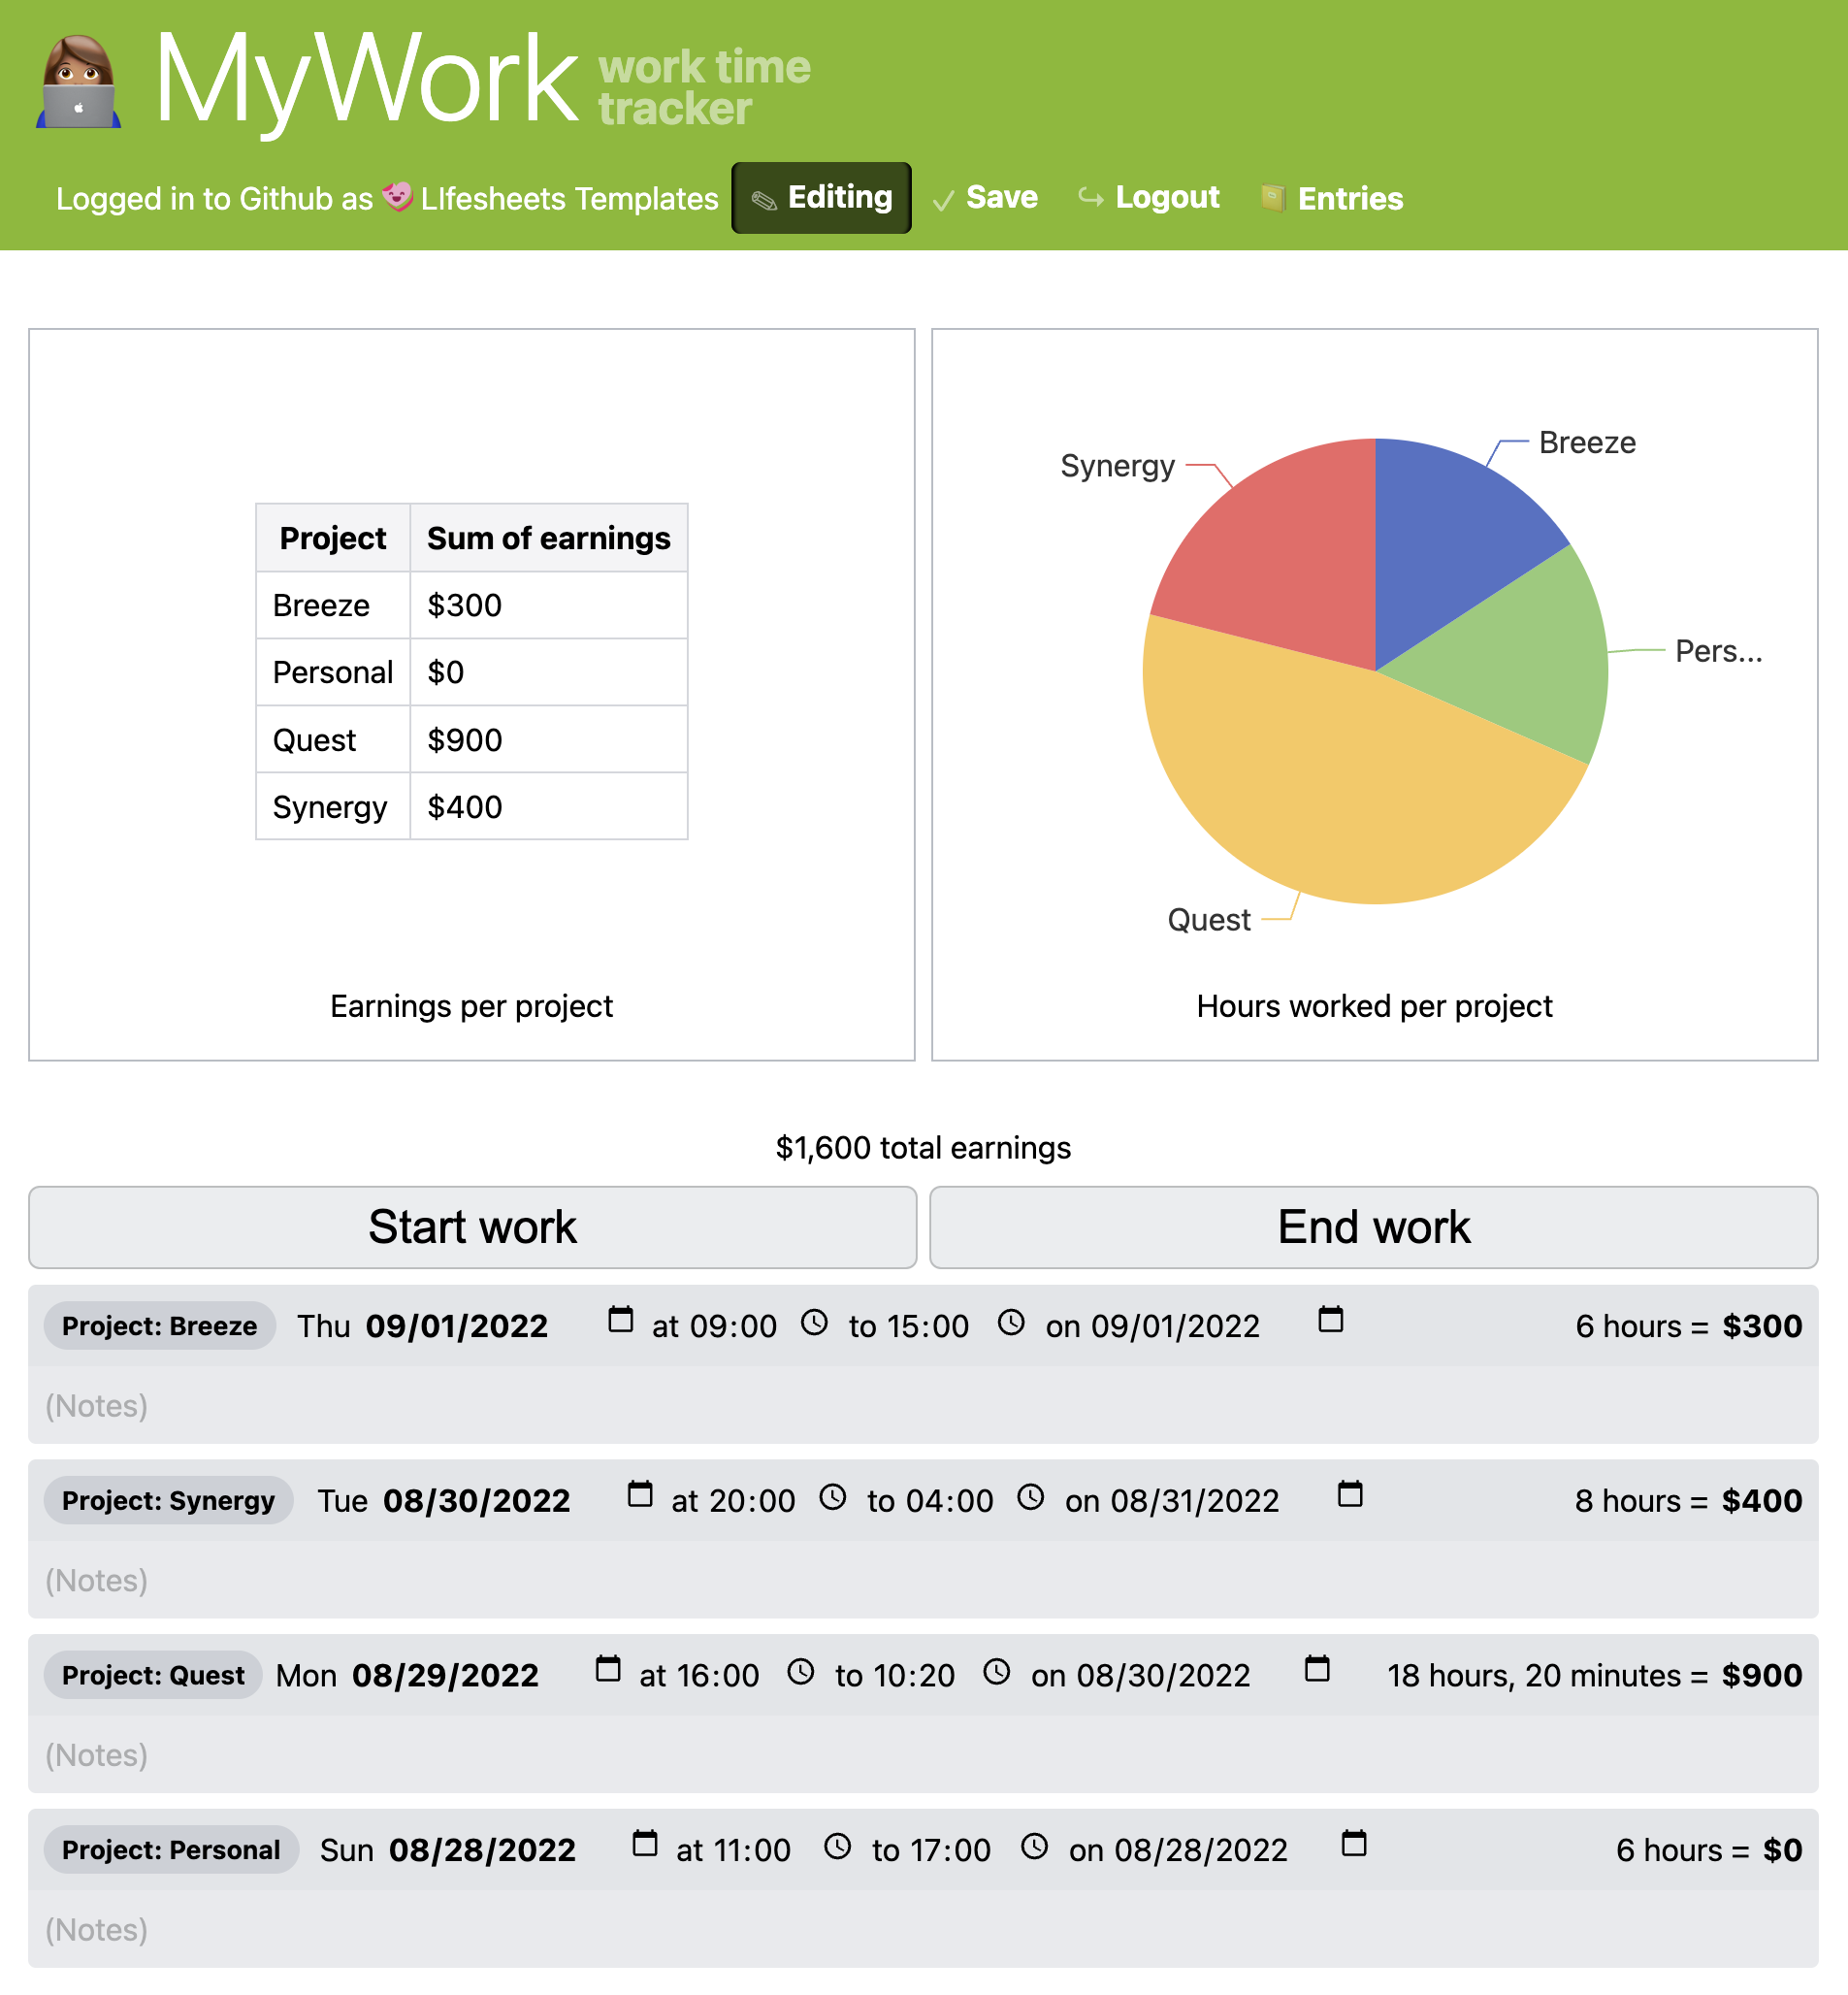
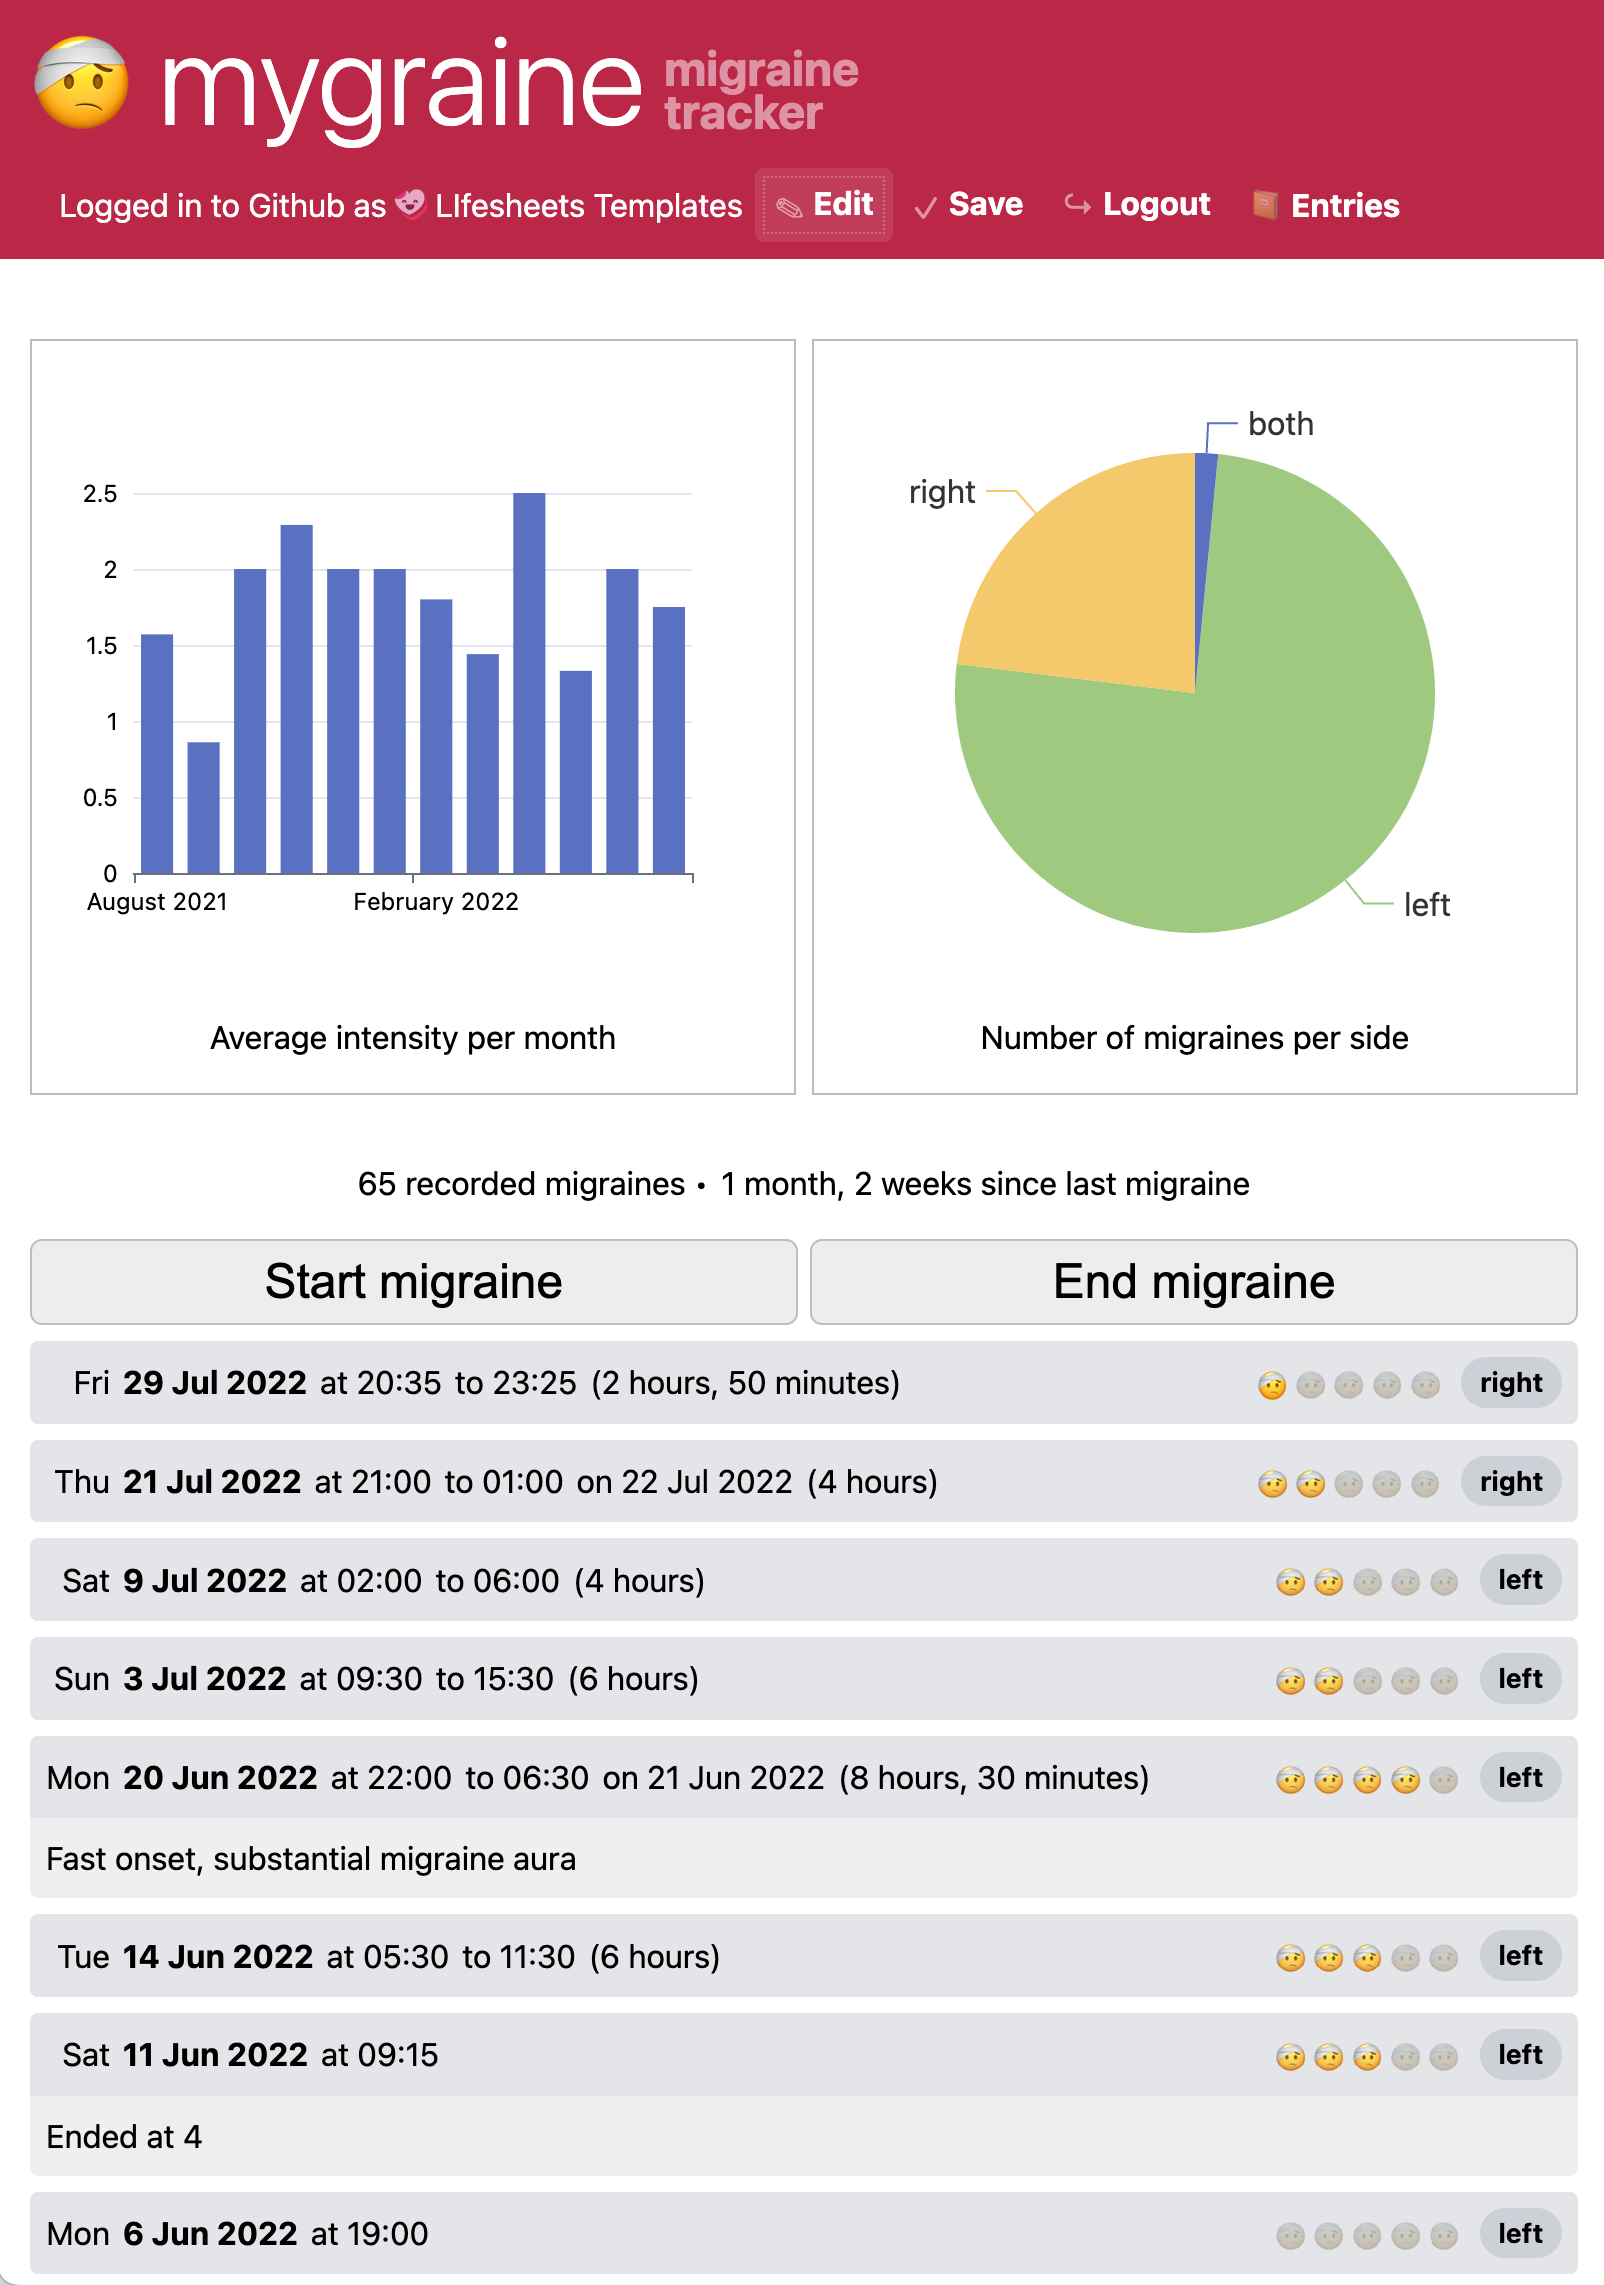
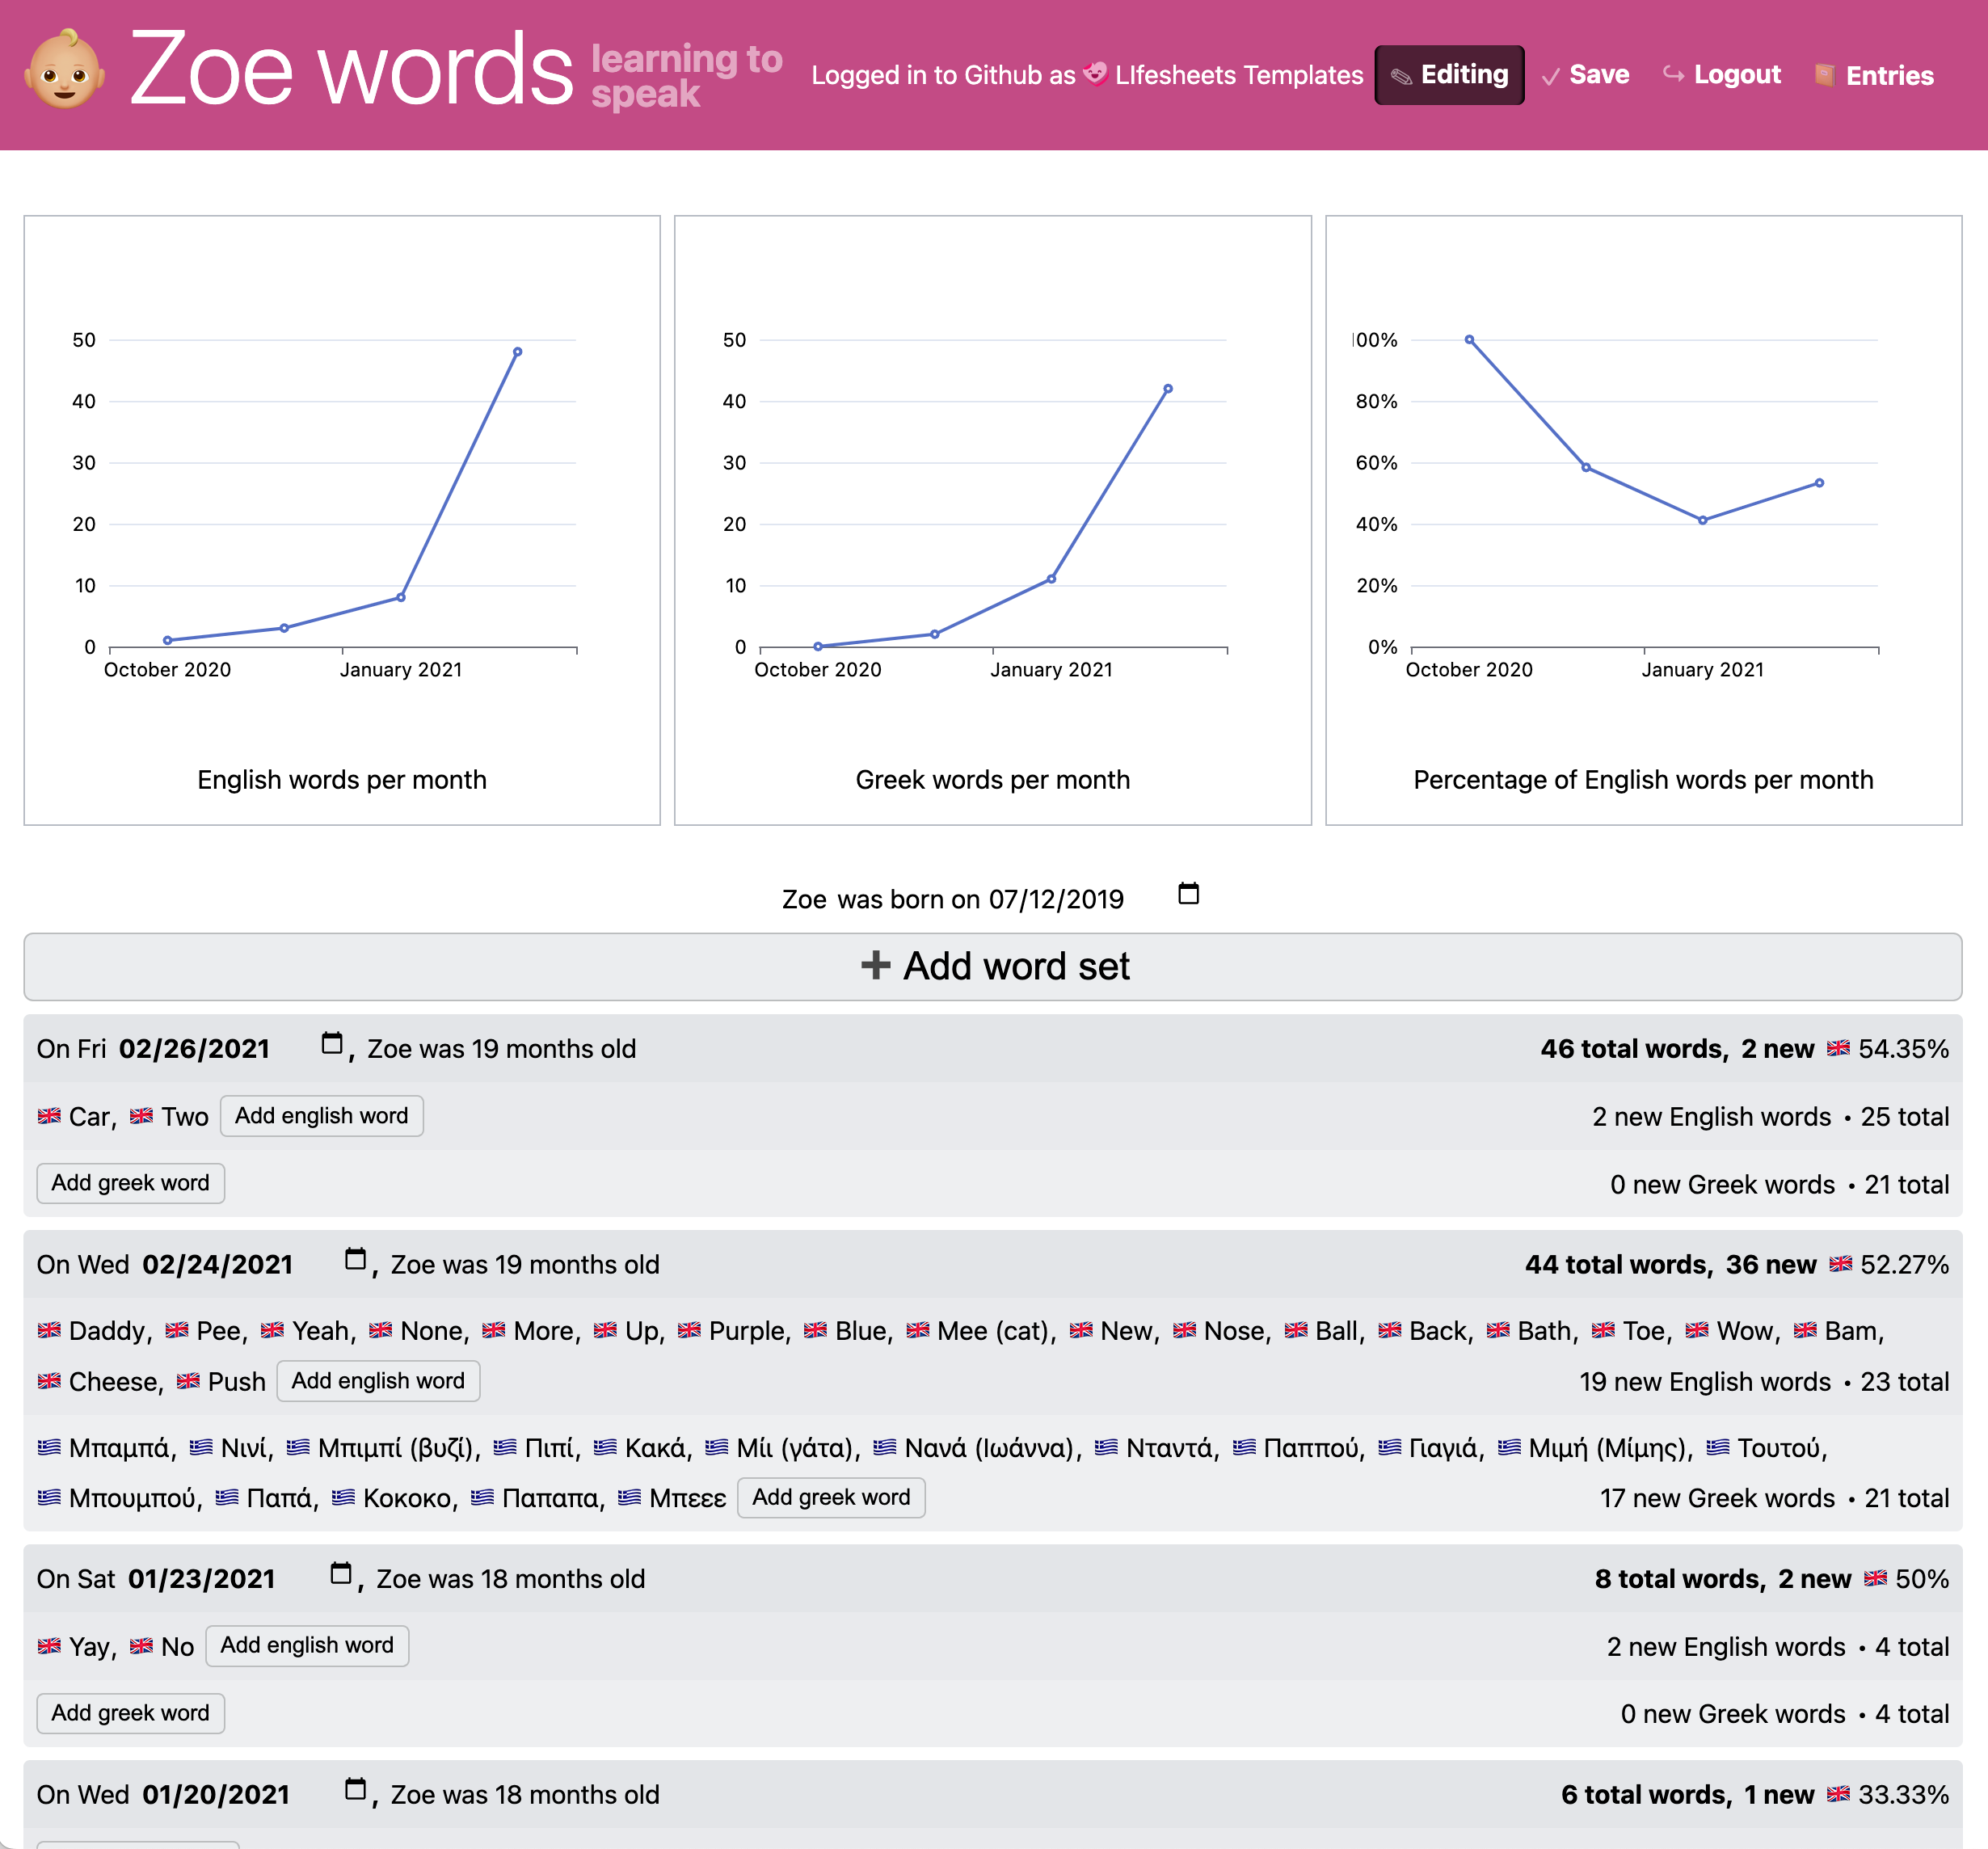
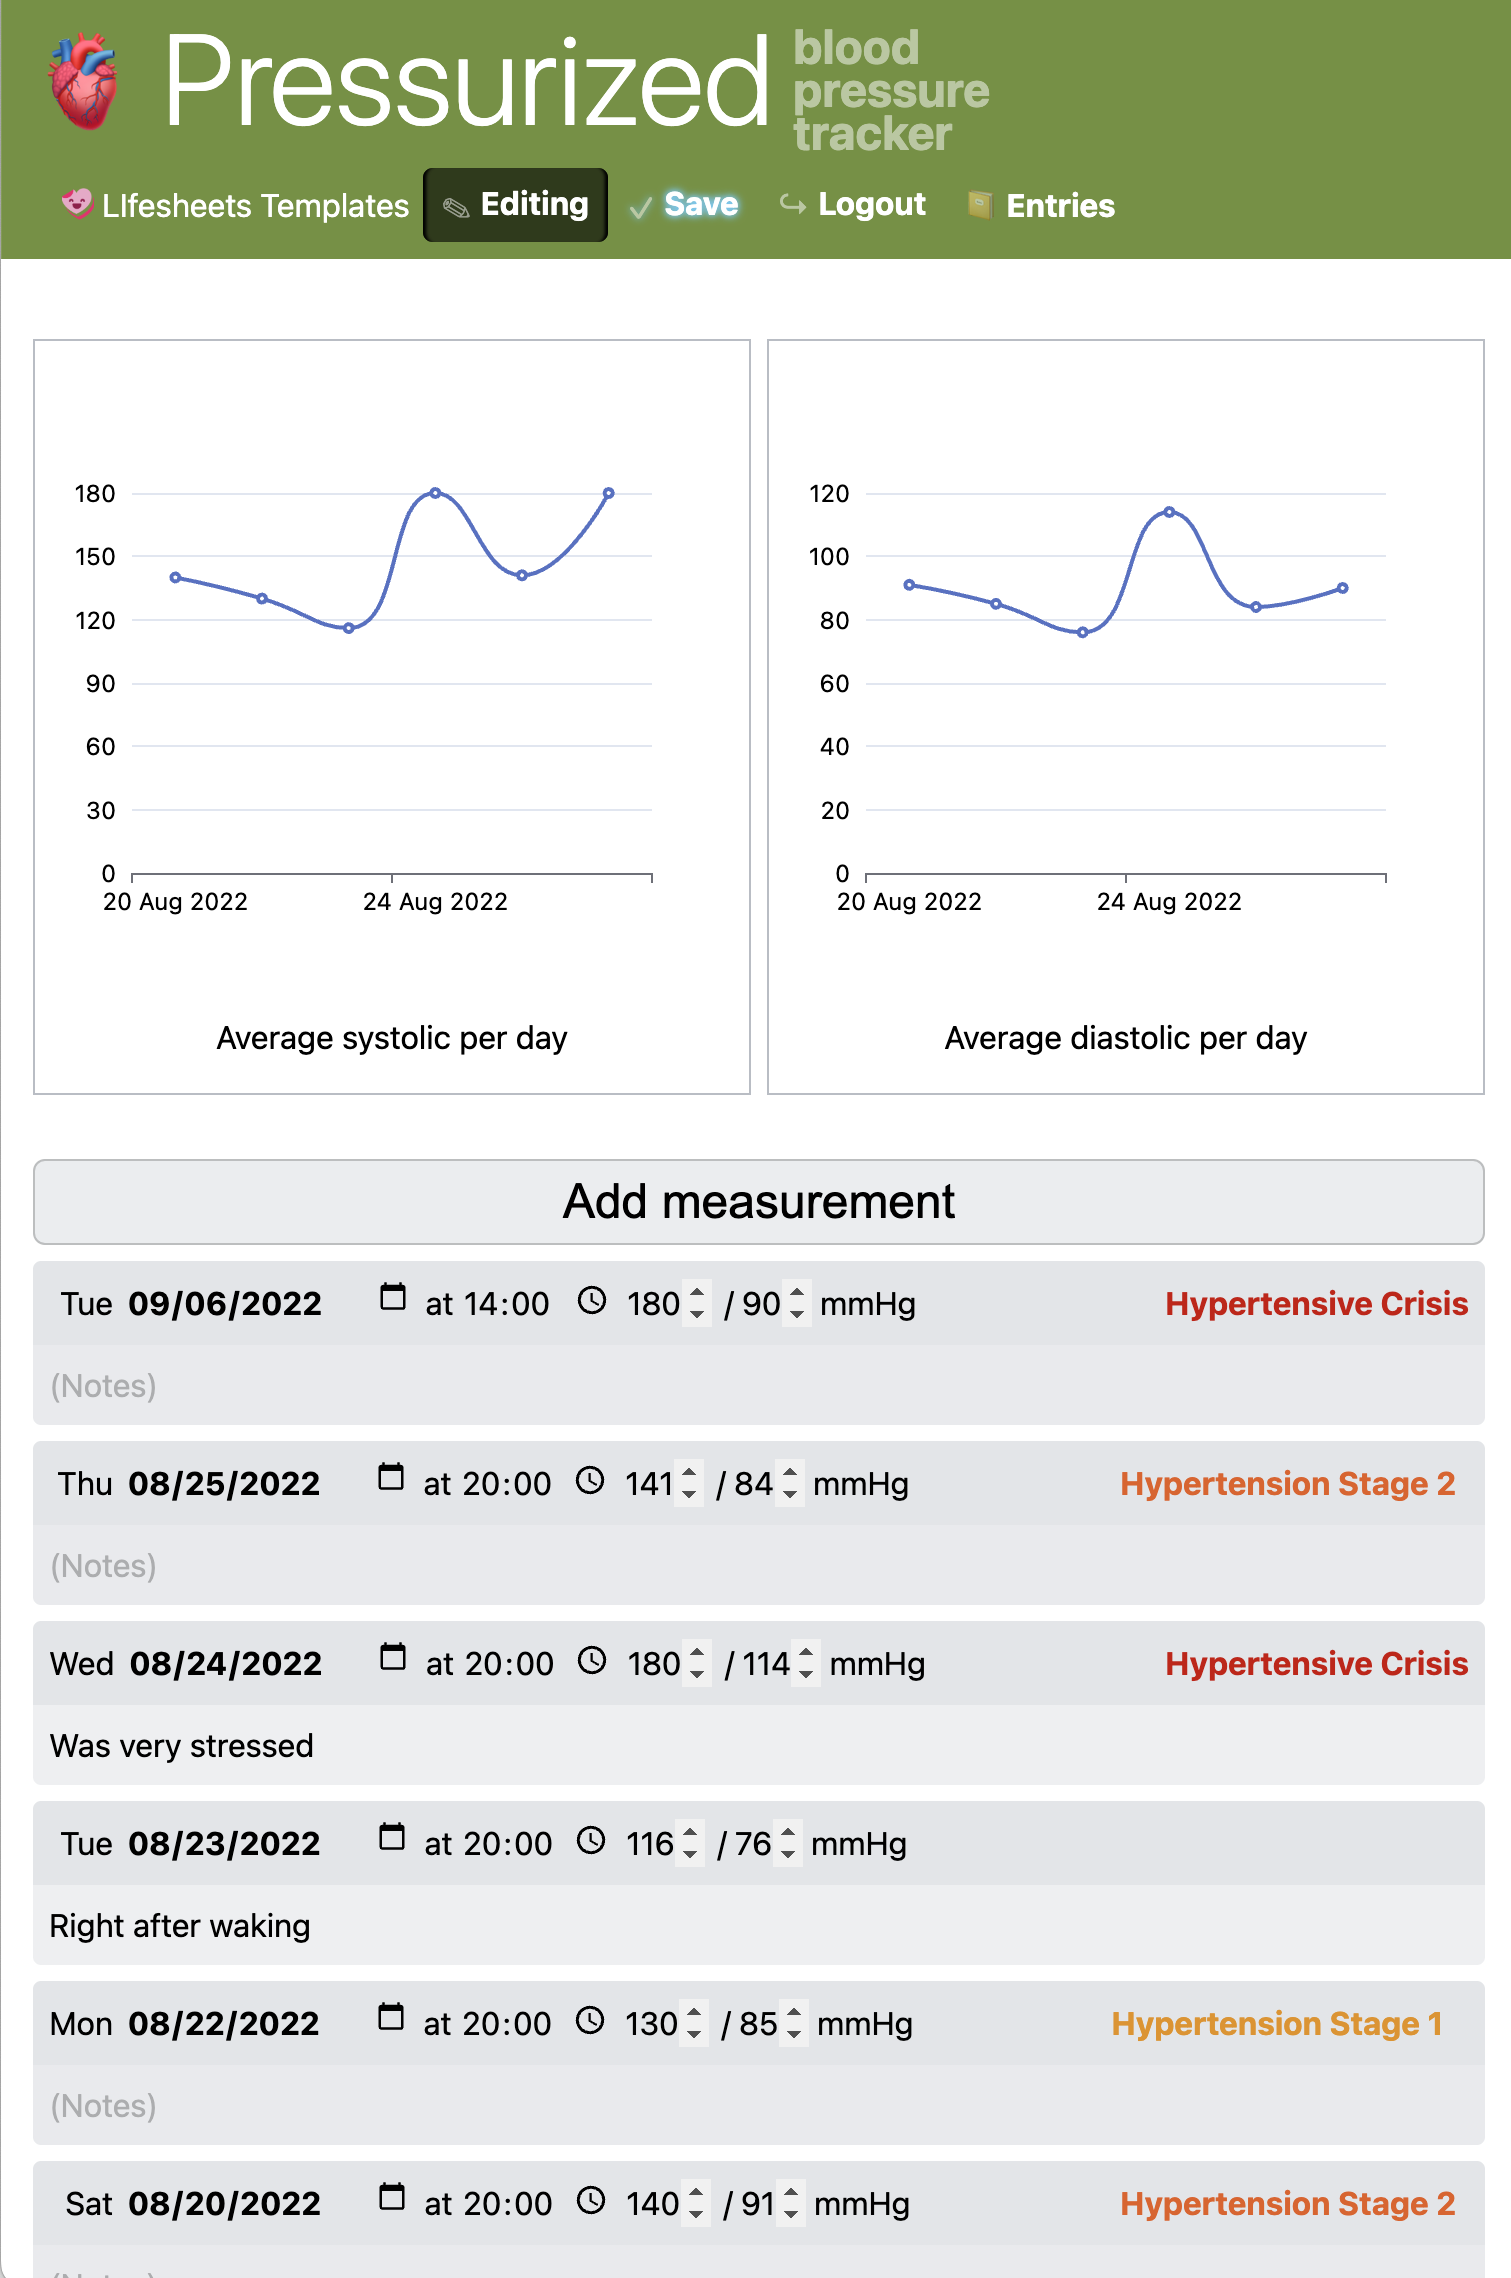
A set of example Lifesheets applications, tracking various aspects of life. From left to right: Work time tracker, migraine tracker, bilingual child vocabulary tracker, blood pressure tracker.
9.1Introduction & Background
While Mavo significantly lowers the barrier for developing full-stack data-driven web applications, writing HTML still requires a certain nontrivial level of technical proficiency. Many end-users struggle to sufficiently conform to any type of syntax, even as permissive as HTML’s.
One of the advantages of extending HTML syntax, is that any sufficiently generic WYSIWYG HTML editor can be used to create Mavo applications. However, while that would remove the syntactic pitfalls, a visual interface has tremendous potential to make the concepts easier to use and understand as well.
Some work in this direction explored adapting a general purpose WYSIWYG editor for HTML to support Mavo with moderately positive results [1].
I hypothesized that perhaps a domain-specific visual application builder could be even more effective, as narrowing down the set of potential use cases also narrows down the design space, and allows for certain assumptions to be made (e.g. about the data model or desired capabilities). This facilitates rapid iteration, and provides increased value per unit of user effort (Section 1.4.2).
Many domains could have been chosen for this, but personal tracking (aka Quantified Self) has several attributes that make it particularly well suited for this exploration:
- It has broad appeal to a majority of the population
- The use cases are not abstract but concrete and relatable,
- The data models involved tend to be shallow but not entirely flat,
- Data ownership and privacy are important concerns
- It makes use of all core Mavo primitives: data editing, lightweight computation (Formula²), Data Update Actions, and unified remote data storage (Madata).
Furthermore, it is yet another domain where user dissatisfaction with available tools is well documented, and validated once more by our needfinding study.
9.1.1Motivation & Core Contributions
Many people wish to record data about themselves or loved ones. Motivations vary: self-awareness, preservation of memories, comparison to others, self-discipline, and many others [2, 3]. Mainstream applications are not flexible enough to cater to users’ diverse needs, and raise concerns about privacy, data ownership, and lock-in to proprietary systems [4–7]. As a result, people regularly resort to spreadsheets, unstructured documents, or even handwriting [8, 9]. Tracking involves high amounts of friction, so data is lost. Often, the process is abandoned altogether [10–12].
We present Lifesheets1We refer to the system as Lifesheets (capitalized) and to the apps created by it as lifesheet(s), a domain-specific End-User Programming (EUP) system empowering end-users to create their own, custom tracking applications. Lifesheets bridges a gap between generic EUP tools and customizable tracking applications: Being domain-specific allows it to produce higher fidelity applications with less effort than generic no-code tools (low threshold), while being designed as an end-user programming tool rather than a customizable tracker allows it to be more flexible and powerful than existing trackers (high ceiling).
We focus on manual tracking in this initial work; but plan to support semi-automated tracking [13] at a later stage. Manual tracking has been shown to improve awareness and facilitate reflection [14–16], but imposes a high capture burden, which Lifesheets reduces through programmable shortcuts, defaults, and input affordances.
Creating these applications requires no more, and often significantly less, technical skill than using spreadsheets. The resulting applications are far easier to use than spreadsheets and much preferred by our user study subjects: Using a standardized SUS questionnaire [17], participants rated the usability of both creating and using Lifesheets as vastly than a spreadsheet.
Lifesheets are private and portable.
Each is represented as a simple Mavo HTML document, interpreted in the browser.
Both the app itself, and its tracked data are stored in the user’s own storage space on a cloud service such as GitHub or Dropbox.
GitHub is used by default, but
any Madata backend can be used, as long as it supports the capabilities necessary (auth, write, upload, host).
Data is private to the user, and there is no dependence on any specific platform:
if their chosen backend goes away, they can simply move their files to another cloud service and continue using all their applications.
The HTML representation also allows power users to customize each lifesheet further with their own HTML or CSS.
Spreadsheets are an obvious default tool for tracking, thanks to their tabular structure. But we identify several limitations of spreadsheets: the visual layout of entries, laborious data capture, and challenges in authoring suitable calculations—especially over dates and times. We then show how to overcome these limitations through our design of Lifesheets.
Beyond customization and input flexibility, Lifesheets increases efficiency in two ways: both by lowering the capture burden per entry, but also the time needed to begin tracking a new thing. As the Greeks say, The beginning is half of every action
:
if starting requires copious amounts of app store research [4] or tedious application building, it requires very high motivation for tracking to commence.
Until then, data is lost.
Beyond our initial goal of studying whether end-users can understand Mavo concepts, or Formula² expressions, and to gauge their reaction to an application using the Madata approach to data storage, this work also includes several other contributions to the Quantified Self and End-User Programming literature:
- We provide numerous insights regarding people’s tracking habits through a survey of 85 participants. A focus is parents tracking data about their child(ren)’s development, a type of personal tracking underexplored in the Personal Informatics literature.
- We identify numerous obstacles to the use of existing tools for personal tracking
- We design and implement Lifesheets, a serverless application builder aimed at overcoming these obstacles
- We evaluate Lifesheets for flexibility by implementing dozens of use cases collected via our needfinding survey, and for learnability and efficiency through a lab study of 10 participants.
- We outline a machine-readable description of tracking applications and their tracked data. Using these, other interoperable systems could allow users to further explore and correlate their data.
The Greeks say “The beginning is half of every action”. If beginning to track requires copious amounts of app store research or tedious application building, it requires very high motivation for tracking to commence. Until then, data is lost. While it is established in the literature that efficiency in using a tracking application is important for users to stick with it [2, 3], we hypothesized that lowering the barrier for beginning the tracking process is equally or more important. If tracking does not commence, there is nothing to stick to. Our needfinding survey confirmed this.
We envision a future where creating a tailored, efficient, personalized tracker that evolves together with the data and adapts to life or goal changes, yet is as high fidelity as commercial applications, can be as easy as creating a document or spreadsheet. In this vision of the future, marginalized groups can take tracking their data into their own hands, rather than depending on third parties who don’t understand them [18] and don’t necessarily have their best interests in mind.
9.2Related Work
To our knowledge, our work is the first that bridges these two main research areas: (1) Personal Informatics, and (2) End-User Programming.
9.2.1Personal Informatics
9.2.1.1Needfinding
Several studies have explored user needs related to personal tracking. Recurring themes were input flexibility [8, 9, 19–21], style/layout customization [6, 8, 9, 19, 20, 22], and privacy [4–7, 9].
Co-design has been used to explore tracking needs, mainly within narrow domains such as food tracking [20] or specific subsets of users, such as youth [6]. This body of work provides additional motivation, as it demonstrates that even within these narrow scopes, user needs are still widely varied. However, this body of work does not answer the question of how these varied tracking applications would be built.
9.2.1.2Pain Points
Previous work has found several usability issues and other barriers with existing tracking tools [2, 5, 18]. Relevant to manual tracking are: (1) low efficiency and usability of data entry [2, 5, 9], (2) data reflection not meeting user needs [2, 5], (3) lack of input flexibility [20], (4) insufficient customization [9], (5) inconvenience of data export [5], (6) privacy concerns [4–7], (7) biases inherent in the design of widely available tools that hamper suitability [18, 23], (8) difficulty in finding a suitable application [4]. We will see that Lifesheets effectively addresses all these issues.
9.2.1.3Ultra-Customizable Trackers
Some attempts to address these issues resulted in highly customizable tracking applications. The only general purpose research system (to our knowledge) is OmniTrack [21]. Other research systems that focus on customizability, such as [7, 19] focus on very narrow tracking domains or use cases (e.g. multiple sclerosis care).
Beyond research systems, there is a variety of commercial applications that attempt to solve this problem, such as Bearable [24], Exist.io [25], DoEntry [26], Nomie [27], or KeepTrack [28].
All of these systems are essentially highly configurable applications, not empowering users to create standalone applications. They require the system that created them to work; they cannot function independently of it, nor outlive it.
There is no computation, nor any extension points to extend the ceiling. Settings accept predefined static values, not formulas.
9.2.1.4Parental Tracking
The subject of personal tracking is not necessarily oneself, but often other loved ones; Parental record-keeping is a subset of personal informatics that is often studied separately. It is further broken down into safety monitoring through sensors [29, 30], and manual record-keeping to preserve memories, detect developmental delays, or as requested by a pediatrician [31–34].
Although parental record-keeping shares a lot with self-tracking, these use cases are distinct in several ways. One big difference is posterity: data needs to be preserved for decades, making data ownership and portability critical.
9.2.2End-user Programming (EUP) Systems
There is a large body of work around empowering end-users to create their own read-write data-driven applications, discussed at length in Chapter 2. It could be argued that self-tracking applications are merely a special case that existing EUP tools can already accommodate. Our work adds to the small body of work around domain-specific EUP systems (e.g. [35–37]) and demonstrates that there are enough commonalities between the diverse set of manual tracking use cases — even after including those outside the common health & wellness domain — that a domain-specific EUP system can significantly smoothen the ease-of-use vs. power curve. We identify significant commonalities in personal tracking use cases that allow us to specialize end-user programming to the personal tracking task; this specialization makes Lifesheets much simpler and more efficient than a general purpose no-code tool. It also lets us create apps that are highly optimized for efficient personal tracking data entry, which is critical. If entering data takes too long, users are less likely to stick with it [3].
9.2.2.1Commercial No-code Tools
In addition to the research literature, we also investigated several popular commercial no-code tools such as Airtable [38], Glide [39], and Coda [40] to compare them with Lifesheets. These tools utilize a spreadsheet-like interface and improve on many spreadsheet issues (e.g. named references, chart chooser interfaces, simple default values). However, they still fall short in many areas that are relevant to personal tracking (namely temporal calculations and charting, non-tabular schemas, reactive defaults, actions for automation).
Temporal calculations are easier in some of these tools, but still challenging. Many non-tabular schemas are still hard (e.g. global variables, multivalued properties).
9.2.2.2Mavo
The Mavo suite of technologies is particularly well-suited to tracking: Managing collections of data (just like tracking entries) is one of its primitives. It facilitates UI customization and reactive defaults for efficient data entry. Its expression language, Formula², is novice-friendly by design and well-suited to data aggregation and temporal calculations. Thanks to Madata, data can be stored independently of the application, in a portable format, and its actions can create data entry shortcuts with a one line expression, reducing capture burden.
However, creating a custom tracker with fidelity comparable to commercial applications still requires a sophisticated understanding of Mavo itself, HTML, CSS, not to mention user interface design skills. Lifesheets wraps Mavo and exposes a higher level abstraction, making it approachable to users who are far less technical than its original target audience.
The Lifesheets GUI does expose several lightly abstracted Mavo concepts to end-users (e.g. expressions, properties, simple collections, actions, data and logic separation). This highlights another contribution of this work: it is one of the first to study exposing Mavo concepts to end-users who cannot necessarily write HTML.
Additionally, the generated Mavo HTML is visible and editable in various places in the Lifesheets GUI as an escape hatch for customization, to further extend the ceiling, while maintaining the low threshold of a GUI (see Section 1.4.1). This smoothens out a common usability cliff of no-code tools: once use cases outgrow the GUI, users are typically directed to scripting languages, which are much harder to learn [41].
9.3Needfinding Survey Summary
We began our work with a survey of 85 participants, recruited through a call for participation on social media and local parent groups in July 2022. The goals of the survey were threefold: (a) collect outlines of tracking use cases (tracked data schemas, reflection, etc.) in bulk, to be used for evaluating the flexibility of Lifesheets, (b) recruit participants for our later user study, (c) collect data to guide the design (complementing existing needfinding literature),
While needfinding is not a primary focus of this work, there are a few novel aspects of this survey compared to existing needfinding work like [4, 8, 9, 22]: (1) Participants in similar studies often forget what they track [20]. To mitigate this, we used a modified version of web probing [42]: we primed participants with a list of 26 (+13 more for parents) common tracking cases, that they could complete in with their own custom cases, using 5 (+4 more for parental tracking) open text fields — a format shown to increase recall [43, 44]). (2) Most existing work studies things actually tracked; we also study things that people want to track, but don’t. (3) We compare self-tracking and parental record-keeping across the same population. We intentionally did not select based on parental status, nor made any special mention of it in our recruitment materials to study it as a special case of personal tracking of self-trackers who also happen to be parents.
To keep the focus on the main contributions, we have placed the bulk of background details and survey findings in the appendix (Appendix A). Here, we focus on observations that specifically demonstrate the general need for programmable end-user tracking apps, surface particular requirements that our design should meet, or relate to the novel aspects of this survey mentioned above.
9.3.1Overview
Participants tracked a median of 7 things for themselves (no difference by parental status), but parents additionally tracked a median of 4 things about their children. While automatic tracking (e.g. step count) was common, more than half of self-tracking use cases and nearly all parental tracking was by manual entry (indicating perhaps that despite the rise of “baby wearables”[29, 30], parental tracking largely remains a manual labor of love).
Popularity of tracking use cases largely validates existing results, but our methodology uncovered a few common use cases that are not present in existing literature. Most notably, sexual activity is the 9th most popular tracking use case (being tracked by 22.35% of participants — equally across genders), despite barely appearing in other studies.
9.3.2Use Case Details
49/85 participants provided additional details on their (manual) tracking methods — a total of 217 tracking instances, 168 of which contained enough details to be included in the Tracking Use Cases dataset that was later used to evaluate Lifesheets for flexibility. 36/49 used a generic tool (handwriting, spreadsheets or note app) for at least one use case. Only half of the things tracked (37.5% for parental tracking) were tracked using a dedicated (web) application. The rest were mostly tracked in spreadsheets, and digital or paper documents.
Lack of suitable tools was by far the most common reason for not tracking desired things (Figure 9.2), with 33/49 participants reporting this as a reason that they don’t track things they want to track.
9.3.3Satisfaction and Complaints
Participants rated the self-tracking tools they use as satisfactory in 64.1% of cases and as unsatisfactory in 18.3%. Tools for parental tracking were associated with lower satisfaction (52.6%), with 18.4% of tools rated as unsatisfactory.
Out of 76 complaints people had with the tools they were using, data entry efficiency was the most common (17 complaints). P47 wants shortcuts and presets: “having presets for exercise types could be useful to make adding records faster, limiting clicks, which would in turn make it less of a hassle to record.” P71 finds using a spreadsheet tedious, even with data validation: “It’s tedious to enter data, especially on a phone. I have to enter the date manually, no defaults. Even in the fields where I have dropdowns it’s still tedious to fill them in.”.
The second most common issue was mismatch between the tracked data schema and their needs (10 complaints). Notably, P81 went into detail on how they use their menstrual tracker to track sexual activity: ‘‘In addition to what I hate about Flo in general, it’s not really a sex tracker, so I have to encode what I actually want to record into its only two modes for recording sex: protected and unprotected. So I have the convention that if penetration happened I log it as “unprotected” otherwise I log it as “protected”. But in actuality, both are protected, because I have an IUD! I’d also like to log things like how good it was, whether we both had an orgasm etc.’’
Other common complaints were insufficient automation (9), the tool does not calculate desired insights (8), no reminders (5), lack of structured data (4), lack of customization (4), and privacy concerns (4). P23 stopped tracking details about their period due to privacy concerns: “One day I had an out of ordinary heavy flow which I tracked in the app. Later that day I saw a targeted ad that I’d never seen before (or since) so I concluded my data had been shared immediately. Since then I’ve only entered start date and have not given detailed info to that app. An app selling such personal data was an affront.”
9.4Lifesheets
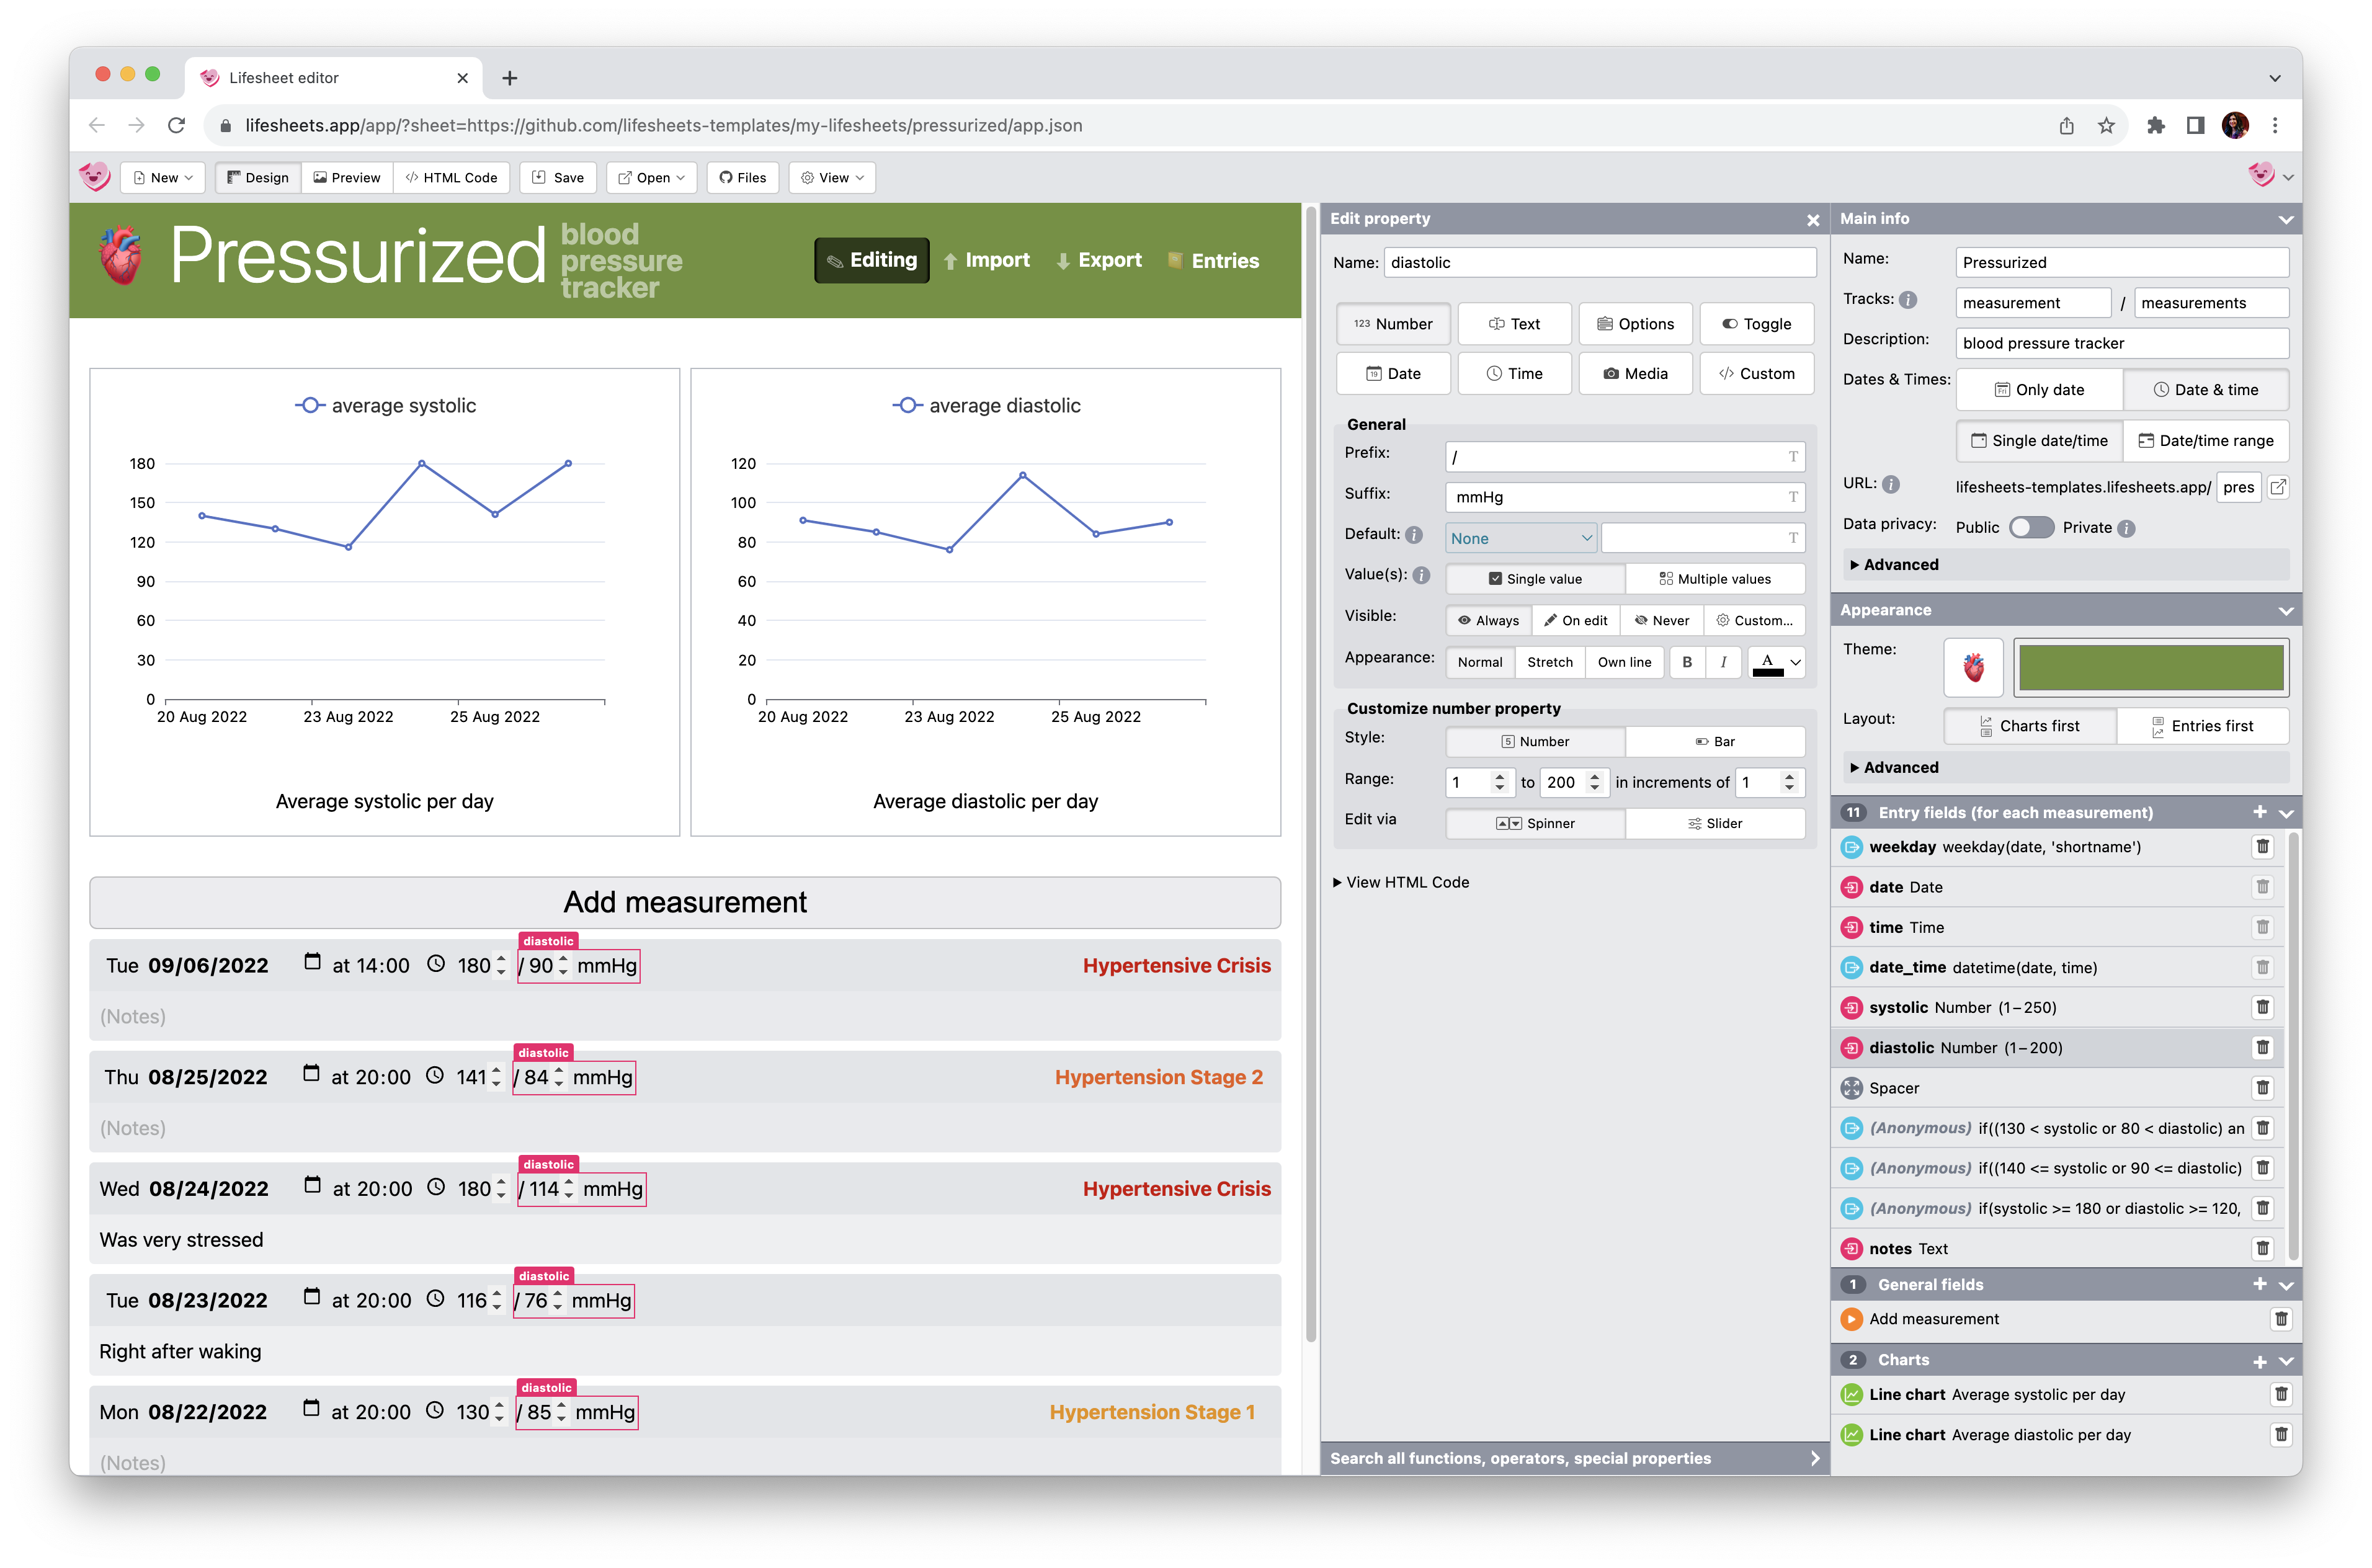
Motivated and informed by our preliminary study and the needs and issues identified in the literature, we designed Lifesheets (Figure 9.3). In this section, we describe Lifesheets’ novel architecture and its main concepts. A functional prototype can be found online at lifesheets.app.
9.4.1Architecture
Lifesheets introduces a novel “serverless” end-user programming ecosystem in which the application is built by the Lifesheets editor but stored in the user’s own cloud storage space. Our prototype only supports GitHub, but other services are straightforward: all that is needed is file storage, static file hosting, and a Web API to control both programmatically. We started from GitHub as it meets all three requirements, simplifying the process. However, it is entirely possible in the future to support using separate services for file storage and web hosting, which would expand the range of services that can be used.
A major advantage of this type of decentralized design is increased privacy and portability: In contrast to the current ecosystem, in which users need to trust each tracking application individually to preserve their privacy, our approach minimizes the trust surface to a single cloud storage provider. Cloud storage providers typically build their reputation on security and privacy, but if trust becomes compromised, copying files to another provider is all it takes to migrate. Although the benefits of this architecture extend beyond tracking applications, they are especially important for tracking, as data preservation is a major need — and the main motivation for parental tracking according to our survey, comprising almost 40% of provided reasons (Figure A.3). In comparison, all other systems we reviewed store data opaquely in proprietary systems that can disappear at any time.
9.4.2Anatomy of a Lifesheet
Lifesheets are standalone web applications consisting of a single index.html file, and a style.css file used for styling.
They are Mavo [41] applications, and thus need no custom JavaScript code to function.
They work on a phone, tablet or computer, and their UI adapts to available space.
These web applications are PWAs2en.wikipedia.org/wiki/Progressive_web_app and thus can be installed on a phone just like a native application.
Their code (HTML and CSS) is generated with readability in mind, to facilitate both learning Mavo, and tinkerability by power users.
Each lifesheet includes its own authentication UI (provided by Madata), which is separate from that of the Lifesheets editor. Lifesheets have two data privacy modes: Public and Private. In both cases, only the owner (and anyone they authorize) can edit data, but in the latter, only the owner can read it as well.
Data tracked with a lifesheet is stored separately from the application, in a cloud location of the user’s choice, or locally in the browser. By default, this is a JSON file in the same directory as the web application (not deployed to the web if the lifesheet is private). The data location is exposed on the Lifesheet editor UI, so that users know where to find their stored data at any given point.
In fact, Lifesheets is the first GUI application to use Madata (Chapter 5) in an end-user facing way, and also the first to offer user-choice on two levels: the location of the application itself, and the location of the tracked data, which can be different. This is a markedly different model than the more common “data export” feature: this data file is not an export, but the primary source of truth. Power users could even write custom tools to read it or even modify it, and their lifesheet would update to incorporate their edits.
9.4.3Data Model
The data model of each lifesheet consists of an array of objects called entries, containing the main tracked data.
Each entry object includes temporal properties (discussed below), as well as arbitrary tracked data.
There may also be root-level data, useful for settings, constants etc.
9.4.4Fields
Fields are the basic building blocks of a lifesheet.
There are four kinds of fields, with distinct purposes:
-
Properties hold stored data and are editable. There are several types of property fields, providing affordances commonly needed in tracking applications [21] (text, number, options, toggles, media, date, time), as well as custom: an arbitrary fragment of Mavo HTML.
Each property can be single-valued (most common), or a collection, with controls to add, delete, and reorder items (for an example, see the list of words in each entry of Figure 9.10).
-
Expressions display reactive calculations, akin to spreadsheet formulas.
-
Actions are buttons that can automate data modifications, e.g. add entries with pre-filled values, set values on certain entries, and/or delete certain entries or elements of any named collection. Data can be static values (e.g.
2) or dynamic expressions (e.g.time($now)). Every lifesheet starts with one general action: the button that adds new entries. -
Spacers are no-op fields that facilitate layout.
Properties and (optionally) expressions are named so so they could be referred in expressions and other places of the editor interface.
Fields may belong to entries and be repeated with them (Entry fields) or to the lifesheet itself (General fields). While most properties are Entry fields, General properties can be useful for global parameters (e.g. hourly rate, child’s name and birthday, currency, etc.). Entry expressions are useful for reflection on the data of that particular entry, or how it relates to the previous entry (e.g. time since previous migraine), while general expressions are useful for aggregate calculations or calculations on a specific type of entry (e.g. first/last).
9.4.5Coping with Time
One of the major ways that Lifesheets simplifies tracker construction is its abstractions over temporal data handling, which (as our user study shows) is still difficult with most general-purpose EUP tools.
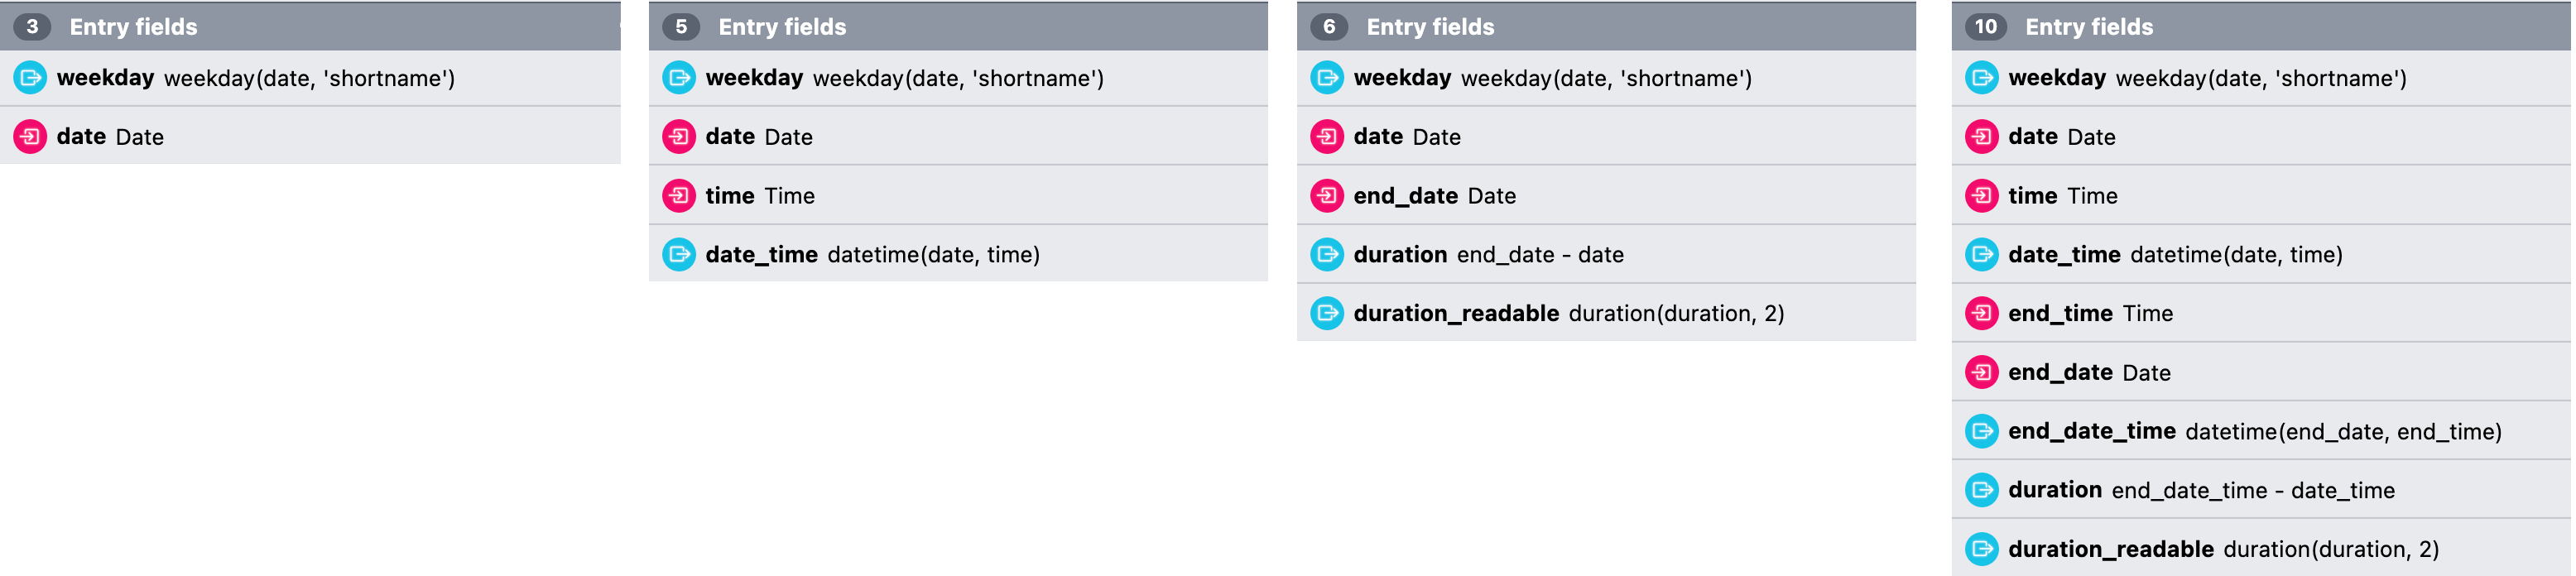
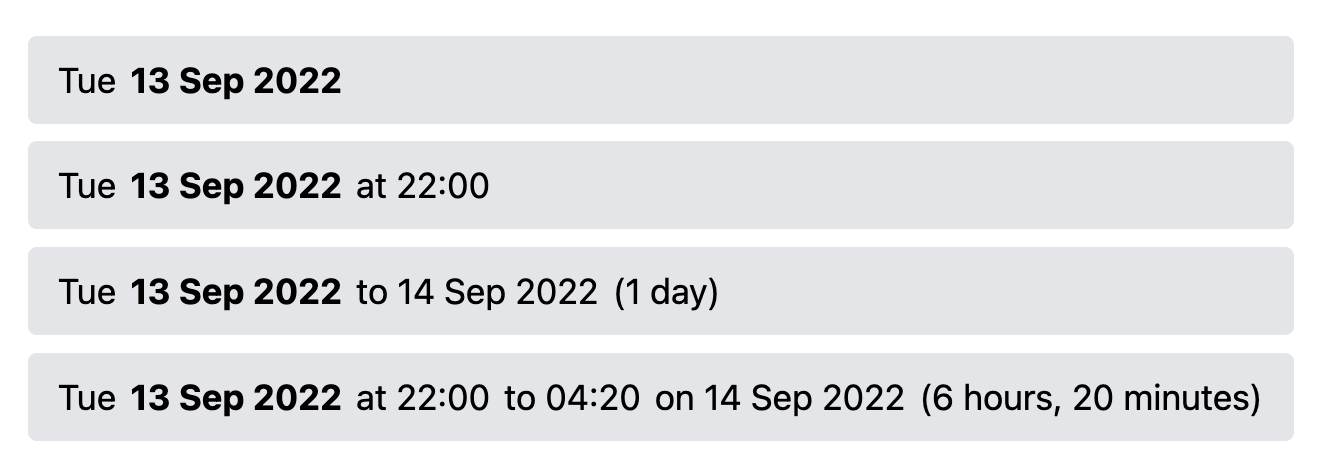
The predefined temporal fields generated with the selection of each temporal category. From left to right: (a) Single Date (b) Single date & time (c) Range of dates (d) Range of dates & times
9.4.5.1Types of Time
Nearly all tracking use cases involve tracking temporal data alongside other variables (the few that don’t are out of scope for this work). However, not all use cases require the same type or granularity of temporal data. We identified four main categories, depending on (a) whether times are needed and (b) whether entries have duration.
-
Single date Each entry includes only a date. These are used for events where time is not relevant, such as very infrequent events. Examples: Child milestones, Medical exam results, Monthly injections, Expenses.
-
Single date & time Used for events that may be tracked multiple times a day but have no duration (or it is not relevant). Examples: Cigarettes smoked, Basal body temperature.
-
Range of dates Examples: Travel.
-
Range of dates & times Examples: Sleep, Nursing sessions, Migraines.
Lifesheets supports all four, through high-level Date & Time settings (Figure 9.3). Choosing one of these categories automatically creates the right fields (Figure 9.4, which include input affordances, computation, dynamic defaults (Figure 9.6) etc. Here are some example entries for each category with no other fields:
The same use case could belong to a different temporal category depending on user needs:
-
Tracking blood sugar would fall under “Single date” for most people who check it once or twice a year, but would be “Date & Time” for diabetes patients that measure it several times a day.3mayoclinic.org/diseases-conditions/diabetes/in-depth/blood-sugar/art-20046628.
-
Menstruation may fall under “Range of dates” for people who only wish to record start and end dates, but could also be “Single date” for people who wish to record flow or other symptoms by day (in that case, expressions would calculate what the start and end is, or it could be marked explicitly).
9.4.5.2Other Predefined Fields
To facilitate efficient tracker creation, in addition to the temporal predefined fields discussed above, every lifesheet also begins with:
- A
notesmultiline text property (Entry field), to capture freeform metadata about the entry. Formatting can be optionally enabled (through Markdown or a WYSIWYG editor), and the field can be deleted if notes are not desirable. - An action (General field) for adding new entries. This can also be optionally deleted and replaced with more specific actions (e.g. that prefill properties with certain values, see Figure 9.12).
This also means that for the simplest of tracking cases which are basically a diary with temporal info, a blank lifesheet, possibly with 1-2 clicks to set the temporal category, is all that is needed.
9.4.6Static & Dynamic Default Values
Default values play an important role in tracking applications, as they can often save significant time in data entry.
Lifesheets takes advantage of Mavo’s reactive defaults (Section 3.3.6) to provide
smart
defaults that are computed based on other properties in the same entry,
or even across entries, and update reactively as the data changes.
But it goes one step further than simply exposing mv-default via a GUI, and provides default default values,
i.e. presets for commonly needed defaults,
in line with our design goal that common use cases should not require typing expressions manually.
All properties include certain presets (e.g. value of the same field in the previous or next entry).
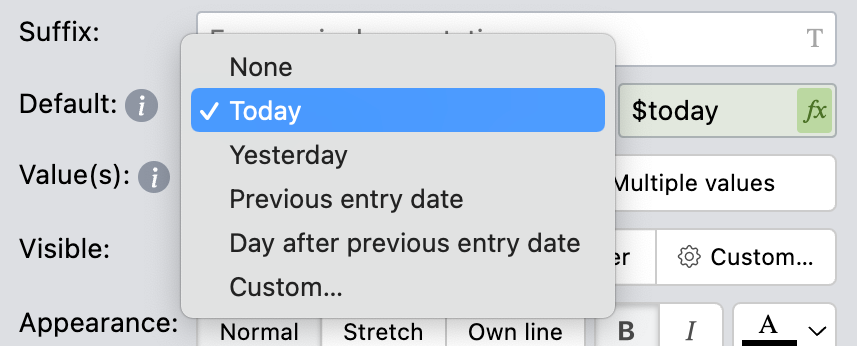
In addition to their “default default” values, temporal fields come with additional default value presets such as day after
,
or start of the hour
, to facilitate common tracking use cases. (Figure 9.6)).
Moreover, these presets serve double duty: the expressions that generate each default are displayed next ot it to facilitate tinkering and to gradually teach users Formula2 syntax.
9.4.7Style Customization
We saw earlier that style customization is one of the most common needs around tracking. Yet neither dedicated tracking applications nor most EUP tools afford much in the way of style customization.
In designing UIs for style customization, there is always the tension between simplicity and power. Too much control can give users too much rope to hang themselves, resulting in UI clutter. Too little and users are unhappy with the result. We incorporated a few basic settings to personalize each lifesheet (Figure 9.3):
9.4.7.1Color
While simple, they allow for producing lifesheets that look fairly diverse (Figure 9.1, Figure 9.12, Figure 9.10, Figure 9.14). We also allow custom CSS for more extensive personalization — originally by power users, but we could easily see an ecosystem of lifesheet themes that non technical users can adopt emerging.
9.4.7.2Layout
In terms of layout, custom applications include optimized layouts that take better advantage of space, and making each entry easier to process,
while spreadsheets and most data-focused no-code
tools are still bound by the limitations of the classic rectangular grid of spreadsheets, or close to it.
A major limitation of spreadsheets compared to custom applications is layout. The rectangular grid rules. Grids facilitate vertical scanning of property values across entries, but have several issues when used for arbitrary data. Each “record” generally occupies only a single row, which for large records might not even fit on the screen. Long values stretch the entire row and/or column. Sparingly used optional fields still occupy an entire column. If users manually violate the grid (e.g. using two rows per record, merging cells, etc.), formula evaluation becomes much harder, and navigation between records functions poorly. In contrast, custom applications often apply far more variability in their layout, taking better advantage of space, highlighting relationships between different fields of a record, and overall making the record easier to understand.
We wanted to bring some of that flexibility to the design of Lifesheets. But in designing any visual application builder, there is always tension around how much control to provide on the resulting layout. Too much control can give users too much rope to hang themselves, resulting in UI clutter. Too little, and users are unhappy with the result.
When laying out a collection of records, there is always the tension between horizontal (grid-based) vs vertical (top-down, “cards”) layouts. Top-down layouts work really well for longform data, but waste space for shorter data. Grid-based layouts have the issues discussed above. It appears that the optimal solution may be a hybrid form [45] where certain fields are laid out left to right, and others top-down. Furthermore, we wanted to support fields that could be next to each other and read as one logical unit, but also a more tabular layout, for use cases that require it.
The solution we chose was to support three appearance settings: “Normal”, “Stretch”, or “Own line” which could be applied on any field, as well as size constraints (min/max width and height). “Normal” (the default appearance) fields are sized based on their contents, which allows them to flow next to each other, and be perceived as one logical unit. “Own line” fields occupy an entire line, which is suitable for longform content. After allocating minimum required space on each line, any remaining space on the same line is distributed equally to fields with an Appearance setting of “Stretch”. “Stretch” is the default appearance for Spacer Fields whose most common use is to align fields on the two sides of the same line. Using only these three appearance settings and size constraints, users can create layouts that range from tabular, top to bottom, or anything in between.
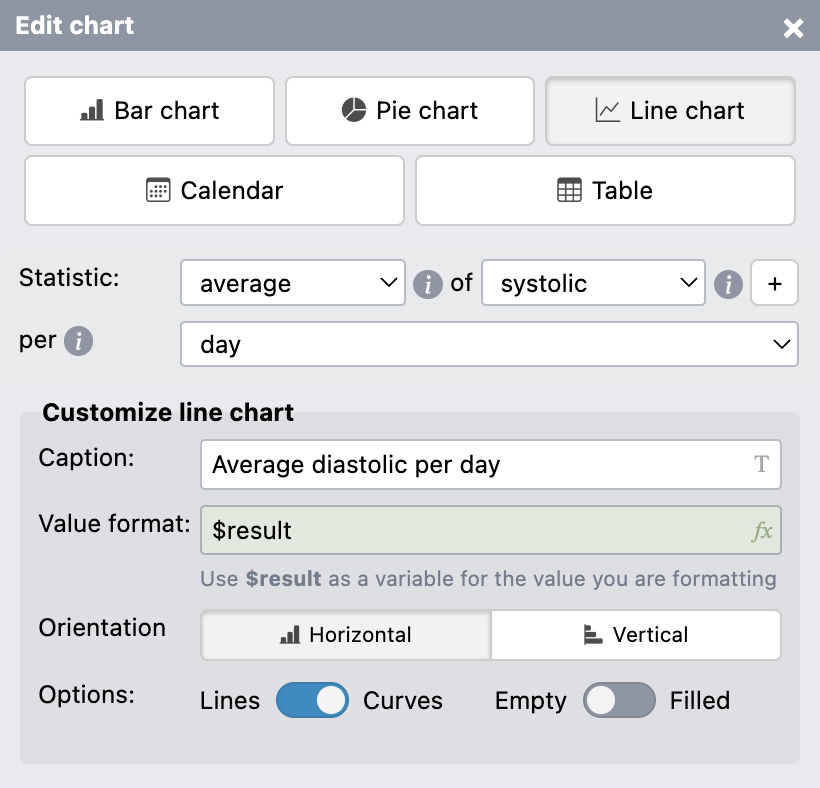
9.4.8Charts
Charts and summary tables are an essential part of the Reflection stage of any personal tracking activity [2]. When designing Lifesheets we looked at the kinds of charts and tables existing tracking applications provided, and designed a minimalistic chart chooser [46] driven by them.
Lifesheets charts are generated based on three parameters: the field we are plotting (properties or named expressions), how to group it (either by temporal factors such as day or month, or distinct values of another named field), and how to combine values within the same group (e.g. count, sum, average, etc). Multiple aggregates over the same parameter can co-exist in the same chart.
To facilitate early detection of slips and aid the user rapidly converge to the desired goal,
the default chart type is table
.
This forces users to verify they have the correct data before moving on to a more complex presentation such as a bar chart or a pie chart.
To support including dynamic charts in Mavo applications (even outside Lifesheets),
we implemented an <h-chart> web component4projects.verou.me/h-chart,
which accepts the data to be charted as a child <table> element and the plotting parameters as HTML attributes.
9.4.9Relationship to Mavo Concepts
Expressions and Actions directly map to the same concepts in Mavo, except they are partly generated via GUIs.
Mavo concepts are largely exposed directly via the Lifesheets GUI, with one exception: computed properties.
A core difference from Mavo is the handling of computed properties. In Mavo, these are framed as properties whose value happens to be an expression, and are typically neither editable nor saved in the data store. Lifesheets has an expression authoring GUI and a property configuration GUI, which are separate. Since configuring a property’s editing UI is rarely useful for computed properties, but expression authoring affordances definitely are, these were instead framed as named expressions.
However, some participants of our user study did inquire about combining the two concepts, e.g. having custom widgets whose value was computed from an expression. This is already somewhat possible by setting a property’s default value to an expression, but that is a workaround, not a first-class concept. This may indicate that a better direction might be to blur the line between the two concepts and make both types of UIs available to both of them, varying only which one is shown by default, and hiding only the parts that truly are not meaningful for computed properties.
Lastly, charts are simply dynamic Mavo collections that use grouping and aggregation to generate a table of data,
which is then either output directly, as a pivot table,
or wrapped in an <h-chart>4:1projects.verou.me/h-chart web component to transform it into a chart.
9.4.10Expression Authoring
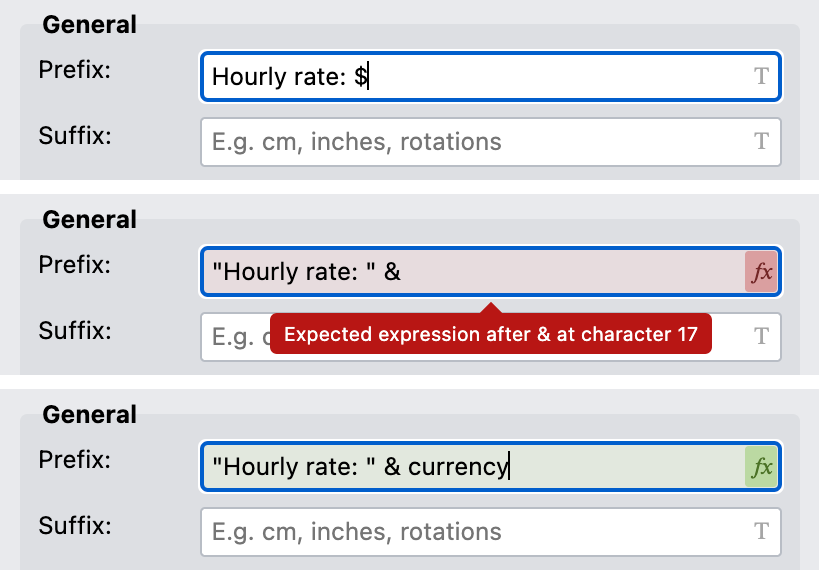
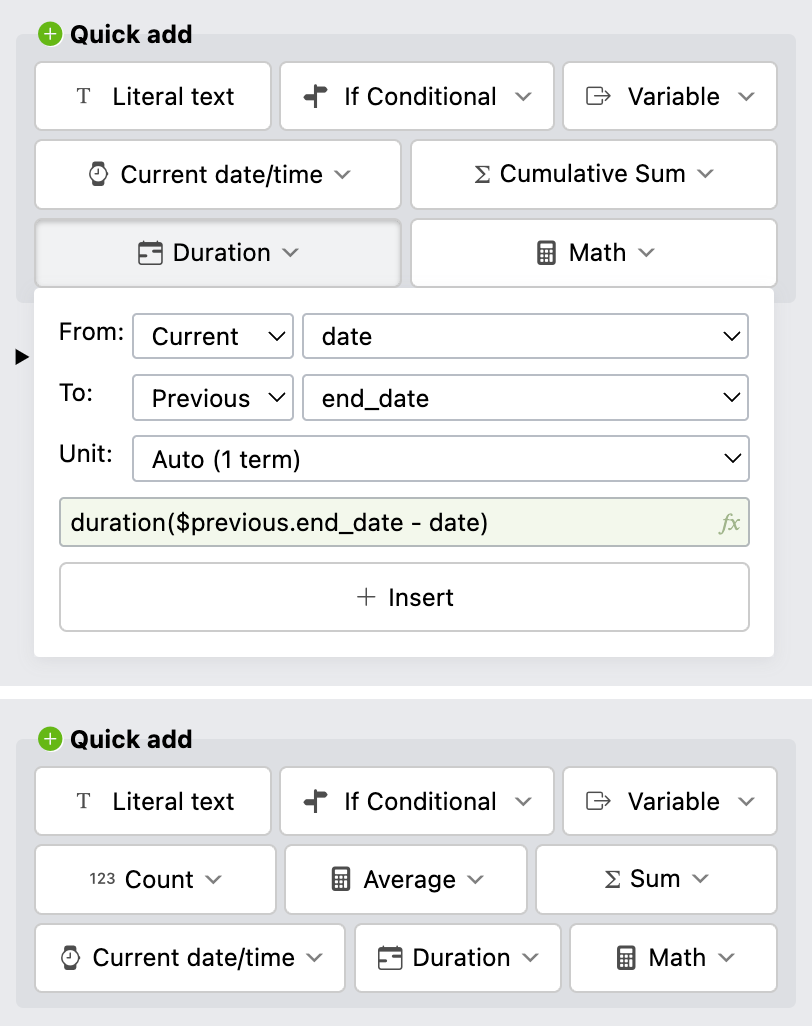
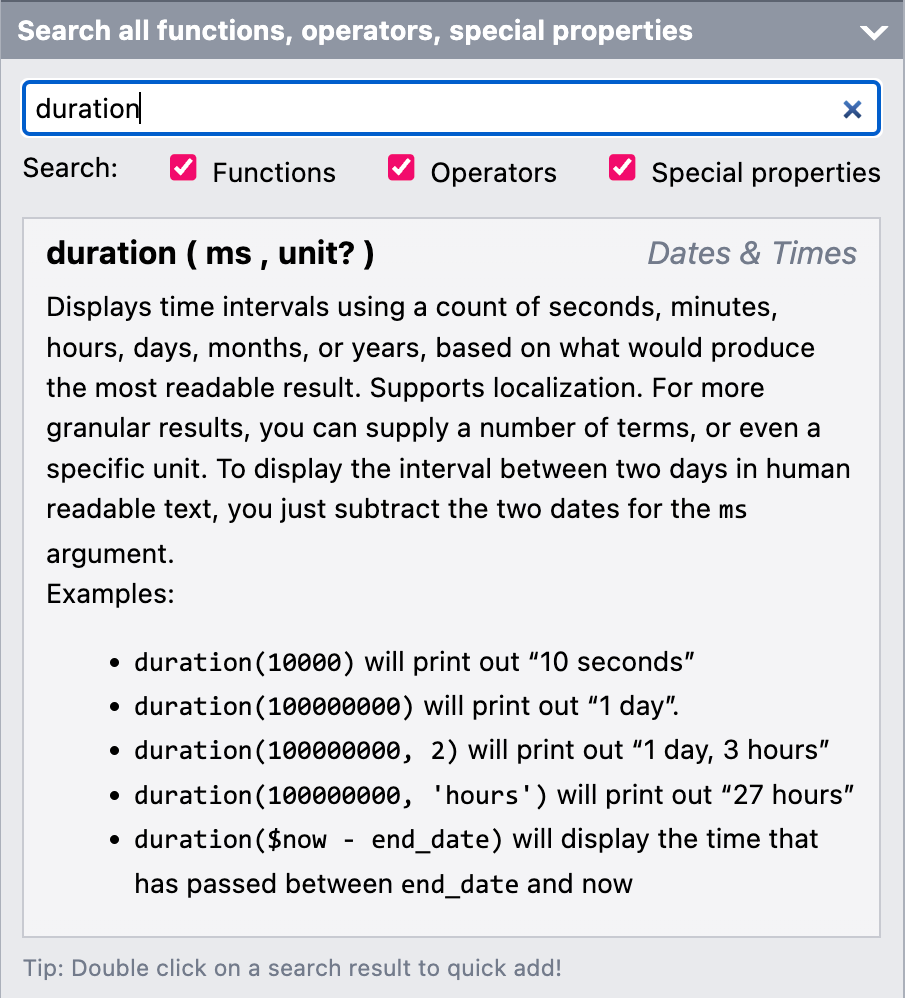
Expression authoring conveniences. From left to right: (a) The text field used in places where expressions are allowed in three states: literal text, invalid expression, valid expression (b) The Quick Add widgets with the Duration widget expanded. Top: entry, bottom: general. (c) The docs browser which opens automatically when an expression is focused, on a suitable entry based on the expression content and caret position.
Expressions are allowed in almost any textual setting (e.g. prefix, suffix, visible, default value, etc).
To indicate this, a text field is used with an icon on the right that is T in literal text mode, or fx in expression mode (Figure 9.9) and can be clicked to toggle between modes. Expression mode includes basic syntax checking, error reporting, and parenthesis balancing. There is also a sidebar widget (Figure 9.9) for browsing Mavo expression documentation that expands every time such an expression field is focused.
However, our goal is that users should not need to type expressions at all for the kinds of calculations that are common in tracking applications. There is a series of widgets that generate function calls for common calculations, such as durations (Figure 9.9), aggregates, or conditionals. The widget allows specifying all parameters through form controls, and displays the resulting expression fragment, to teach the user how to write expressions.
These function calls can be tweaked, then inserted in the main expression field, and then tweaked further. Unfortunately, this is currently only available for the main expression in Expression fields, and not anywhere an expression can be written.
9.4.11Viewing Modes
The Lifesheets editor offers two view modes: Design (default) and Preview. The Design mode allows users to click to click on a field to open its configuration editor, as well as edit the main app info in a WYSIWYG way. The Preview mode allows users to use the app they are creating, verify that expressions, actions, and charts work as expected etc. The modes are necessary to differentiate what happens when a user clicks on a field—are they configuring that field or editing its value?
9.4.12Supporting Tinkering and Iteration
Tinkerability is important in the design of any creative interface [47], and crucial for end-user programmers [48] who are less aware of what exactly they are doing.
In Lifesheets, most edits to the application schema are non-destructive: users can create a prototype of their tracking application, use it to store data, then return to the Lifesheets editor later and evolve it based on changes to their needs or new insights.
If the author removes a field that has been used to enter data, its data is preserved in case the user decides to bring it back.
This is also why range start date and time are named date and time, instead of start_date and start_time: to support experimentation with different temporal categories.
9.5Standardizing Tracked Data
Currently, all existing tracking applications define their own tracked ad hoc data schemas. Even when data export is supported, there is little non-programmer users can do with this data. To our knowledge, there is no standard data schema for this type of data, so that different applications can interoperate.
We believe that there is value in converging towards a data schema that all these different applications can use. JSON is a good language for defining this, due to its popularity as a data interchange format and its support for nested data structures (unlike e.g. CSV). For example, one can imagine a user choosing to use one tracking application for its superior data entry capabilities, another for its data analysis capabilities, and a third one for correlations across data tracked by multiple different applications. Since Lifesheets had to be designed to accommodate a very wide variety of tracking use cases, a secondary contribution of this work is to pave the way towards such a standard schema for tracking data.
Even without a description of the tracking use case, the data Lifesheets produces has several commonalities that would allow a third-party application to process them meaningfully: all data includes a root object, with an entry key that includes an array of entries, as well as any global properties. Entries are objects, whose values are primitives or arrays of primitives. Temporal fields (date, time, end_date, end_time) are standardized across all use cases and their values are the same format (ISO 86015iso.org/standard/70907.html).
Lifesheets also produces a JSON description of the tracker, which can be used by third party apps to make sense of the rest of the data properties that are not shared across lifesheets.
The data from each tracker is stored as a JSON file in the user’s chosen file space.
The general shape of all tracked data is a root object, with an “entry” key which contains the list of entries in an array, plus keys for any root properties, if any are present.
Entries are represented by JSON objects. Properties are represented by object keys with primitive values, except multi-valued properties which are stored as arrays of primitives. Expressions are not stored, even if they are named. ISO 8601[49] is used for dates and times.
We use date and time instead of start_date and start_time as the default property names for the start of the primary time interval;
this keeps the names consistent if the author switches between time-point and time-interval data models in their app.
Dates and times are stored separately and joined into datetime values (per ISO 8601 [49]) via expressions at runtime. This design was chosen because in these kinds of use cases different data entries can be of different fidelities: e.g. one may want to record a life event that generally has a time granularity, but not remember the time for a given entry.
Here is an example data entry from the migraine application:
{
	"date": "2021-09-13",
	"time": "14:40",
	"end_time": "16:30",
	"end_date": "2021-09-13",
	"notes": "Strong headache since wakeup",
	"intensity": 2,
	"side": "left"
}
Apart from the tracked data, the description of each Lifesheet is also stored as a JSON file, which is a higher level description than the generated Mavo application.
Using the tracker schema, any application could interpret the tracked data in the same way that Lifesheets does.
We believe if such schemas were to be standardized and used across tracking applications, even as an export format, it could benefit users by maximizing interoperability and data portability. For example, even if a particular tracking application does not allow the user to derive correlations on their data, there could be a third-party application that allows users to upload various tracking data and derive correlations and other insights.
Third-party applications can process data even without a description of the tracking application, but having that allows them to interpret the data too or even provide alternative editing interfaces.
Each application is represented by a JSON object with keys:
app: Main app information (e.g. name, what is being tracked, etc)temporal: An object with two boolean keys:timesandranges, to select a temporal categoryentry,root,charts: Arrays of objects for entry fields, general fields, and charts respectively
Each field (including charts) is represented as an object with:
- a
typekey (values: property, expression, action, spacer, chart) - a
name(mandatory in properties, optional in expressions) - a
flagsarray with flags like"temporal"for storing special state about auto-generated properties - a
settingsobject with various options, depending on the field
9.6Lifesheets Case Studies
Part of our argument is that Lifesheets has sufficient flexibility to easily specify a broad range of manual tracking use cases. To support that argument, we looked at the tracking use cases outlined by our needfinding survey participants (description, plus answers to “What data do you record for each entry?” and “How do the tool(s) you use help you understand your data?”). Three researchers worked together to review these use cases for implementability with Lifesheets.
For semi-automatic cases, we only considered the manual component.
Researchers split the 168 use cases into four categories: i) Invalid, not enough data to discern what the answer was trying to convey or participant had misunderstood the question (7) ii) Use cases where at least one of the researchers could outline a complete Lifesheets implementation (properties, expressions, actions, charts) were marked as “Implementable” (153, or 95% of valid use cases). If they were not sure, they implemented the use case. iii) Use cases that the researchers were certain could not be implemented, were marked as “Not implementable” (6) iv) The remaining two use cases were marked as “Borderline” (2).
9.6.1Discussion
The data entry component of nearly all valid use cases (161/162 or 99.4%) was implementable with Lifesheets’ design. The one that was not, was a running tracker with a running route drawn on a map, as Lifesheets does not support drawing as an input widget (drawing on a map and uploading it through a media property would have worked, but is suboptimal), not does it connect to any wearable location tracking devices.
For the remaining 7 unimplemented or borderline cases, the issues were:
- The 2/8 borderline cases needed correlations between different tracked data. Visual correlations are possible, by tracking all data on the same lifesheet and plotting two different fields on the same chart. However, it may be suboptimal to use the same tracker for both, and we cannot know if participants were referring to visual correlations or computed ones.
- 3/8 required access to existing large datasets or APIs (nutritional info of foods, locations of places). Small datasets (e.g. baby teeth duration, or WHO child growth data) can be entered as hidden general fields and used in expressions or plotted in charts. However, this becomes impractical above a certain number of data points (≈ 20 or so).
- 1/8 needed notifications
- 1/8 required a proprietary calculation of fitness level. This may be feasible with expressions, but there is no way to know without more details.
It is important to note that Lifesheets requires more knowledge than simply reaching for a widely available application.
For example, in a menstrual/ovulation tracker (3 use cases), ovulation can be predicted by adding the average cycle length to the cycle start date and subtracting 14 days
(in Formula² expressions: date + avg_cycle_length - 14 * days() where avg_cycle_length is a general expression with value average(duration).
However, not everyone would be able to perform this calculation.
In practice, we expect that once Lifesheets is deployed widely,
only a few users would need to know how to implement the calculations for common cases, and the rest would simply “fork” their sheets and customize them.
The use case data as well as the researcher assessments is included in the supplementary materials.
9.6.2Detailed Case Studies
In this section, we present more details about some of the more interesting, complex cases we implemented.
9.6.2.1Bilingual Child Vocabulary
While most respondents who wanted to track their child’s language development only tracked words with dates, there was one who listed “language” as one of the fields they track.
Any vocabulary tracker (even a monolingual one) is an example of a tracking application that requires a hierarchical schema, and thus, is hard to do with spreadsheets or most no-code tools.
This is an outline of the lifesheet implementation:
- Temporal category is Single Date
- Two (one for each language) multi-valued Text properties with 0 initial items. We use prefixes to distinguish the two.
- Two named expressions to count the new words in each entry, e.g.
english_word_countwith valuecount(english_word)6Can be generated with widgets - Two cumulative sum expressions to count total words, e.g.
total_english_word_countwith value$previous.total_english_word_count + english_word_count - Named expressions for counting total vocabulary and total new words (e.g.
total_english_word_count + total_greek_word_count)7Can mostly be generated with widgets, plus a little editing - Expressions to calculate percentage of vocabulary by language (e.g. an
english_percentageexpression with value100 * (total_english_word_count / total_word_count)) - An expression to show the age of the child when the entry was entered
- Three line charts, two for showing the average word count per month for each language and one for plotting the percentage of English per month
While it is not strictly necessary for implementing this use case for one’s own needs,
we also included a general birthday Date property and a child_name property (we could use hardcoded values), to allow others to “fork” the sheet and use it for their own child(ren)
without having to comb through every expression to figure out what to change.
The resulting application can be seen in Figure 9.10 and the implementation can be explored at lifesheets.app/app/?sheet=github.com/lifesheets-templates/my-lifesheets/zoe-words/app.json©=1. It can be trivially modified to support trilingual or other polylingual families.
9.6.2.2Babysitting Calculator
This lifesheet tracks hours worked by a babysitter, payments by the parents, as well as occasional expenses, and displays total balance owed.
This lifesheet showcases a useful pattern: how one can emulate heterogeneous entries with different temporal characteristics. Conceptually, it needs three types of entries:
- Care that is a regular date/time range entry with no other fields
- Payment which corresponds to a payment by the parents, and does not need anything more than a date and an amount.
- Balance which adjusts the balance by a specific amount. This is useful for a) consolidating past entries into a single equivalent entry and b) reimbursing the babysitter for expenses (e.g. museum tickets). Like Payment, this only needs a date and an amount.
To implement this, we add a type Options property with three values: Care, Payment, Balance.
We select the widest temporal category that we need (range of dates & times).
We then set the visibility of end_time, end_date, end_time to an expression that only shows them when type = ’Care’.
Similarly, amount is only shown when type != ’Care’.
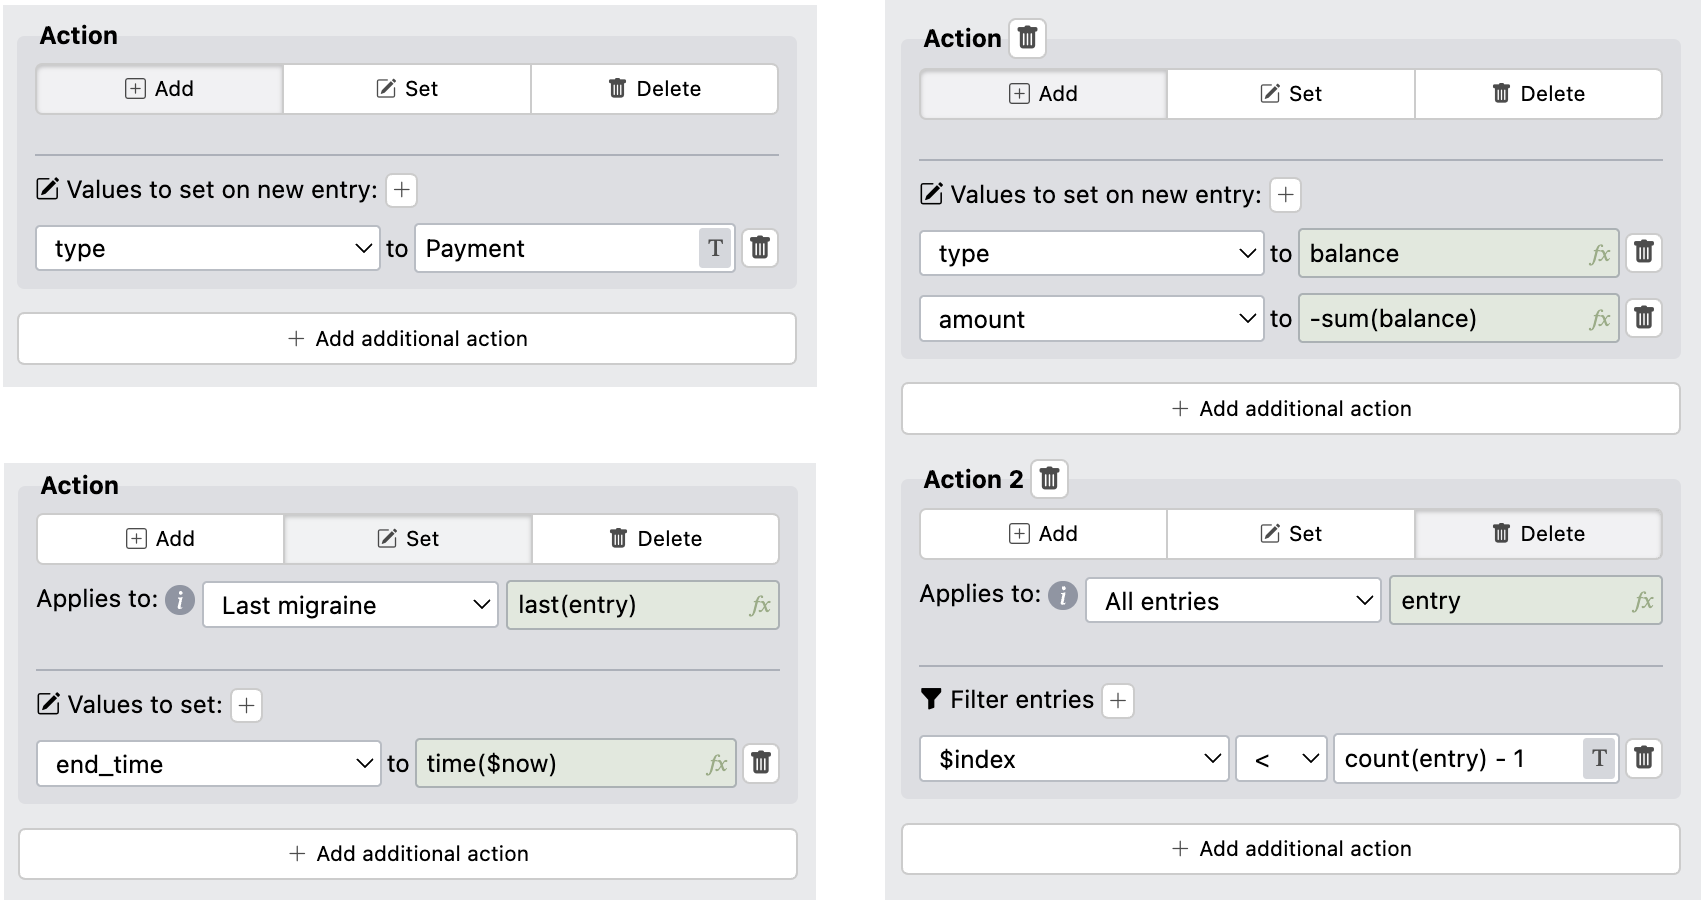
To facilitate data entry and automation, we implement three actions: i) Two actions for entering each type of entry and ii) An action to consolidate entries, which adds a Balance entry with the value of the total balance, and deletes all entries after it (see Figure 9.11).
The rest is simple properties, and expressions that can be directly generated with widgets. Like in the previous case, we have made this more generalizable by introducing general properties for currency and hourly rate and used them in the corresponding prefixes and calculations, so that it can be copied and used by others.
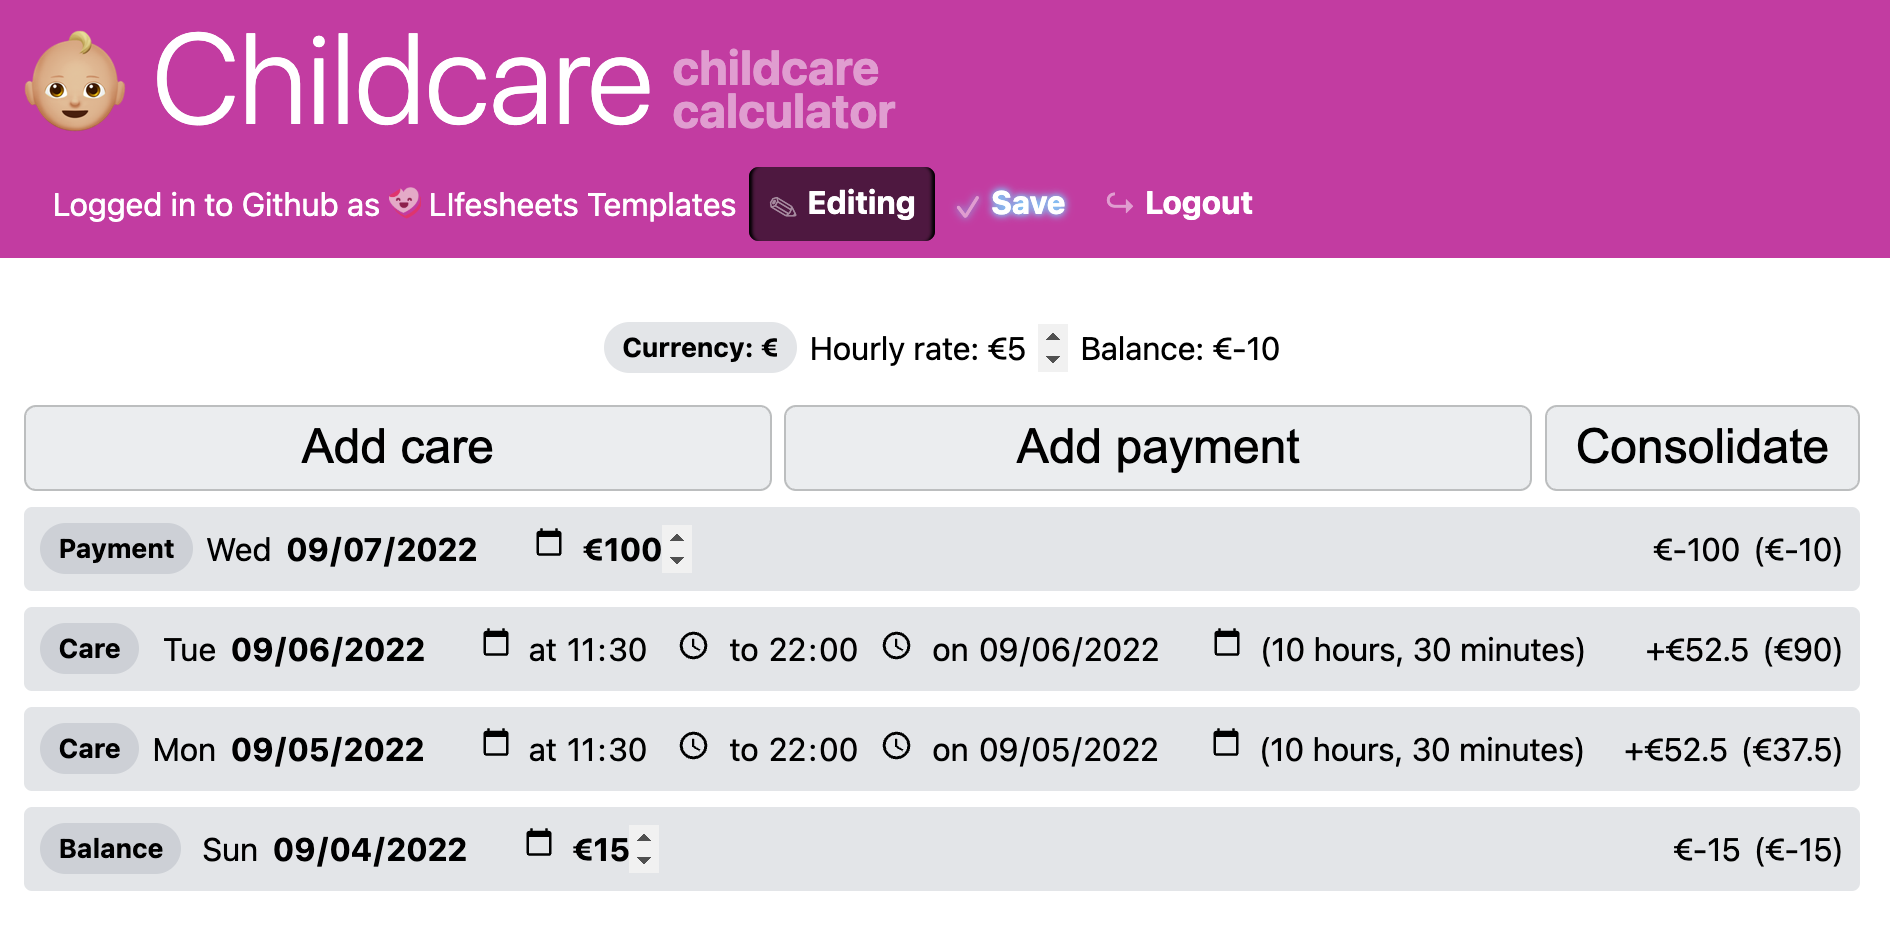
The application can be seen in Figure 9.12 and the detailed implementation can be explored in lifesheets.app/app/?sheet=github.com/lifesheets-templates/my-lifesheets/childcare/app.json©=1 .
9.7User Study
To evaluate Lifesheets’ learnability and efficiency, we ran a user study of 10 participants. We used spreadsheets as a control because they are the most common tool people reach for when they cannot find a suitable application (Section A.1.6).
9.7.1Participants
The 10 (2 female) participants were recruited among survey respondents that fulfilled the following inclusion criteria: (1) Had opted-in to participating in the user study, (2) had enough familiarity with spreadsheets to write basic formulas and (3) track or want to track at least 6 things total (self-tracking + parental tracking)
Ages ranged from 30 to 47 (median = 39, x̅ = 38.6, σ = 4.9). 5/10 were parents (1 female). 5/10 had little to no programming experience. 3/10 rated their ability to write spreadsheet formulas “advanced” and 7/10 “basic”. User study sessions were conducted over Zoom and took 90-120 minutes each.
9.7.1.1Procedure and Study Setup
| Tracking application | Spreadsheet | Lifesheet |
|---|---|---|
| 🤕 Migraine | Create a new sheet to keep track of your migraines. Each migraine should have: Date and time it started and ended (if it has ended), Intensity of pain (1-5), Side of head (left, right, or both) | |
| Add sample data 1 (3 entries) | ||
| On each migraine, display its duration in a human-readable way | (Not Applicable) | |
| Display the time that has passed since the last migraine ended | ||
| Show a bar chart with the average intensity per month | ||
| Show a pie chart with the breakdown of migraines per side | ||
| (Not Applicable) | Add button to end the last migraine. | |
| Add sample data 2 (1 entry) | ||
| 👩🏽💻 Productivity | Create a new sheet to keep track of your worked hours. Each work session should include the date and time you started and stopped working, and which project (Personal, Synergy, Breeze, Quest) | |
| Add sample data 1 (3 entries) | ||
| On each work session, display its duration in a human-readable way | (Not Applicable) | |
| On each work session, display the amount of money earned assuming an hourly rate of $50. You do not charge for fractions of an hour. | ||
| Now modify this to show 0 earnings when the project is "Personal" | ||
| Display your total earnings to date. | ||
| Display a table with your total earnings per project | ||
| Display a pie chart with the hours you worked on each project | ||
| Add sample data 2 (1 entry) | ||
We used a within-subjects design, with each participant creating a specific tracking application with Lifesheets and a different one with Google Sheets. Both the assigned apps and the order of the two conditions were randomized and counterbalanced. The two applications were (a) a Migraine tracker and (b) a Productivity tracker. We selected these use cases as the two tasks for a variety of reasons: (a) both were among the most common use cases (Figure A.1) (b) both required date and time ranges, the most complex of the four temporal categories (c) they were implementable with Lifesheets, but nontrivial
Participants were first briefly interviewed about their tracking habits (primarily to build rapport). The control condition consisted of them creating their assigned application in Google Sheets step by step Table 9.1.
The experimental condition consisted of them watching a 7 min recorded tutorial about Lifesheets, then doing a small practice task (smoking tracker) for x̅ = 10min where the researcher could help them. A smoking tracker was selected because it was simple to implement, yet practiced all core Lifesheets concepts. Then they would go on to create their assigned lifesheet, without researcher help.
If there was time at the end (unfortunately only in 4/10 of sessions), participants were encouraged to work on a freeform task for their own needs.
After these tasks, participants completed a post-study questionnaire which included separate System Usability Scale (SUS) [17] questions about creating and using the application, for both conditions. It also included a few multiple-choice questions about their experience with Lifesheets and how it compares to spreadsheets and tailored tracking applications. Participants completed the post-study survey on their own, without researcher oversight.
9.8Results & Discussion
| Spreadsheet | Lifesheet | |
|---|---|---|
| 🤕 Migraine |
|
|
| 👩🏽💻 Productivity |
|
|
As shown in Table 9.2, participants generally succeeded more at implementing these applications with Lifesheets compared to spreadsheets, took less time, and failed at fewer tasks.
There were recurring patterns in the issues participants faced in either condition, which we discuss below.
9.8.1Lifesheets UI
9.8.1.1Personalization
The Lifesheets’ personalization features were well-received, despite being spartan. All 10 participants customized at least one aspect of the application style (color, icon), even though they were not asked to by any task.
9.8.1.2Name vs Prefix vs Suffix vs Label
Nearly all participants tried to use the “Name” field as a visible label, rather than an identifier for referencing. Most recovered once they saw the error in the UI, but 2/10 needed researcher intervention (and were counted as failures).
Even after, some struggled to find where to actually place a human-readable label, as they did not identify “Prefix” and “Suffix” as suitable and were looking for a “Label” field. All were able to recover, and preferred prefix/suffix over their initial expectation.
9.8.1.3Preview Modes
Most participants did not understand the difference between the different preview modes (Design mode, Preview mode, opening the app in a new tab).
They expected to be able to save data in Preview mode, in which the data entered is currently intended for experimentation only. Some expected that “Save” in the Lifesheets editor would also save the data they had entered (it saves the lifesheet itself — which includes a separate Save button to save data).
The participants with the least programming experience expected the Design view to have more WYSIWYG features (e.g. moving fields around with drag & drop), while the programmers were generally content to use the sidebar and did not even use the WYSIWYG features that the Design view did support.
9.8.2Data Entry
It is hard to measure the real efficiency difference of using a lifesheet in a lab setting: since data entry is artificial, with dates and times in the past, the user is fighting against the default values, rather than taking advantage of them.
Regardless, we observed a significant difference in the last data entry task (no signficant difference in the first task): adding one item took a median of 20s (migraine: 18s, productivity: 23s) in Lifesheets and a median of 57s (migraine: 53s, productivity: 59s) in spreadsheets. In the Migraine task this was largely due to the “End migraine” action from ML6 as the migraine to add had just finished. All participants used the action they had created instead of entering data manually. However, Producitivity did not include any actions, and yet the difference was comparable. We hypothesize that participants had simply grown more familiar with lifesheets by then and could take better advantage of the interface.
The predefined temporal fields of Lifesheets implement the common UI pattern where the end date is not shown until an end time is entered, as it uses a dynamic default value that depends on the start date, and both times. This initially confused 2/10 participants as they were looking to enter an end date before entering an end time.
Customization can be a double-edged sword: U9 had reordered their fields to experiment with the interface and had trouble during the data entry task because controls were in unpredictable places. 3/10 were initially confused that new entries were added to the top, they expected them to be appended. Interestingly, their expected behavior would have resulted in worse ergonomics: if entries were added to the end, one needs to scroll through all entries to see and edit their new entry, or just to see the most recent data.
3/10 participants did not notice that a placeholder entry existed when they began entering data, and just ignored it, then were confused that there was a superfluous entry. The placeholder entry was not surprising in the preview while editing the application, it only became suprising when actually using the application. To address this, we plan to start with 0 entries outside the editing environment in the future, and only use a placeholder entry in the preview.
9.8.3Formulas
9.8.3.1Referencing Data
Most participants struggled with spreadsheet cell references at least once, regardless of whether they used the selection GUI or tried to write out references.
Several participants made errors that would have been apparent with column names,
but were difficult to discern with spreadsheet ranges such as e.g. E2:E9.
In some cases, the error itself was that the participant attempted to reference a column by its header, rather than use a range.
None used named ranges to overcome these issues.
There was no such issue in the Lifesheets condition, as names are used for referencing.
9.8.3.2Datatypes and Operations
In both conditions, participants struggled with operations due to unexpected operand types.
In spreadsheets, many struggled to perform operations between dates because their entered dates were treated as text.
Some operations produced duration values (e.g. 2:5) which they could not interpret or reformat to make more human-readable.
In Lifesheets, many tried to do math with the output of the duration() function, which is a text value (e.g. "5 months").
Predictably, those with programming experience figured the issue out far faster than the rest.
Specifically for durations, this pattern can be easily supported, by making duration() return a text value that when coerced to a number returns the number of milliseconds
(which is what date/time functions expect).
9.8.3.3Duration Math
Nearly all participants struggled to calculate durations and present them in a human-readable format with spreadsheets. The participants most successful at these tasks subtracted two date/time values and formatted the result as a duration, but this was still not particularly human-readable (it was presented as hh:mm:ss, even for durations over 24 hours, e.g. “607:0:0”).
Their data modeling intuition played a crucial role in setting them up success: none of the 5/10 who started their spreadsheets with separate dates and times could figure out how to combine them to get a single date/time value to perform calculations with.
Subtracting date/times produced a fractional number of days, which they found confusing.
Searching the documentation or googling for help yielded functions that did not help them (such as DATEDIF() or DURATION(),
both of which are for date intervals, and not date/time intervals).
The Productivity condition includes a task where hours worked need to be multiplied by hourly rate to display earnings (WS4/WL3).
3/5 subjects struggled with this in the spreadsheet condition,
as multiplying a duration with a number produces a result formatted as a duration with unclear units (e.g. 25:3).
No-one was able to present the time since the last migraine in the spreadsheet.
One participant thought of using MAX() to get the latest date, but could not present the difference between that and the current time in a human-readable way.
Participants were vocal about their frustration while attempting any tasks that involved math between date/time intervals in spreadsheets.
“this is giving me a headache” — U1
“Honestly, I would rather calculate it manually and not use a formula” — U4
“I never did something like that with spreadsheets and it really sucks. I can cry” — U5
“That was frustrating” — U6
“This is showing me how much I don’t like Google Sheets” — U9
All participants were able to accomplish these tasks in Lifesheets.
For entry duration, there was no corresponding task because Lifesheets displays this in a human-readable way automatically
(e.g. 3 days, 5 hours
or 1 hour, 30 minutes
).
Everyone used the Duration widget to calculate time since last migraine (ML3), though 2/5 were confused about the “Auto” unit (but tried it anyway).
9.8.3.4Conditionals
Only the productivity tracker required the use of a conditional (WS5, WL4).
3/5 participants were successful in using IF() for it in spreadsheets, and 5/5 in Lifesheets.
All 5 participants in Lifesheets used the Conditional widget instead of writing an expression,
4/5 successfully (U7 did not understand they could have an “Otherwise” value as well).
Despite this being a task that would really benefit from auxiliary data (e.g. a separate hourly rate field), only one participant in each condition thought to create a separate spreadsheet column or field to make the expression more readable. This validates the existing finding that end-user programmers reuse by cloning [50].
9.8.3.5Aggregates
Only the productivity tracker required the use of an aggregate (total earnings, WS6/WL5).
All participants were able to accomplish this, under both conditions.
In Spreadsheets, 4/5 participants wrote the formula on their own, and one used the menu to insert a SUM() that they then edited.
In Lifesheets, all 5 participants used the Sum widget.
One had not given a name to their (in-entry) earnings expression, but named it then so that it could be used as the argument to the sum.
9.8.4Data Modeling
9.8.4.1Temporal Data
Handling temporal data was particularly difficult in spreadsheets. There is a tension: meaningful temporal calculations require combined date/time values, but that is not a natural format for human data entry. Our study verified this tension: half our participants started with separate columns for dates and times, then struggled to combine them for calculations. More than half (3/5) did not include an end date, only an end time, expecting to be able to calculate the end date from the other three columns. The other half started with combined date/time values, but then struggled to enter them textually, with 2/5 of which completely failing to figure out a textual format that was recognized as a date/time.
Despite spreadsheets providing a way to constrain input to a specific format (data validation), which also displays suitable input widgets (e.g. a date picker), only 2/10 participants used it for dates and times (and only 4/10 for any value).
In Lifesheets, all 10 participants selected the correct temporal category without hesitation.
9.8.4.2Other Data Modeling Tasks
There were few differences in non-temporal data modeling tasks in spreadsheets. All participants were able to create the necessary properties with roughly similar names. Only 4/10 used any type of data validation.
In Lifesheets, 9/10 customized the entry name, 1/10 was happy with the default entry
.
In the Migraine task, all selected “migraine”, whereas in the Productivity tracker,
names were more varied: “hours worked” (2), “task”, “session”, and “work”.
This is expected: a migraine is a concrete event, while a work session is more abstract.
All 10 participants created suitable properties and correctly understood the difference between property types. All 10 participants selected suitable types for their properties with minimal experimentation. While none of the tasks required multi-valued properties, every participant seemed to understand what selecting “Multiple values” did (it turns the property into a collection), and could recognize that they did not need it for these tasks (4/10 after experimentation). Across both tasks, 4/10 participants experimented with selecting “Multiple values” on a Text property instead of selecting an Options property in the corresponding subtask, but seeing the collection management controls it created was enough feedback to help them realize it was not what they needed.
Some more specific data modeling observations:
- Migraine:
- Intensity: All 5 participants selected a Number type
- Side: 4/5 selected an Options property; one created two toggles instead: left, and right.
- Productivity:
- Project name: All 5 participants used an Options property
9.8.5Pivot Tables and Charts
Each structured task included two forms of reflection visualizations, that were essentially grouping tasks: Migraine called for a bar chart of average intensity by month (MS5/ML4), and a pie chart of the breakdown of migraines per side (MS6/ML5), while the Productivity app called for a table of total earnings per project (WS7, WL6), and a pie chart of hours worked on each project (WS8/WL7).
Participants generally struggled a lot with these in spreadsheets, especially those involving temporal grouping and aggregation. While it is known that spreadsheet charting interfaces are generally poor [51], the main issue at play seemed to be unrelated to these issues. Indirection was a big barrier: if creating the chart required auxiliary data such as a separate column or a pivot table, users struggled. Participants generally expected to be able to create the visualizations through a combination of settings in the charting interface, and continued trying different parameters until they got the right result (often as a happy accident), or got frustrated and gave up.
Non-programmers struggled more with indirection. We hypothesize this is because programmers are more used to creating “helper variables” as containers for intermediate values, while end-users expect to be able to achieve their goal by selecting the right combination of user interface settings. Interestingly however, even programmers had trouble with auxiliary columns in spreadsheets.
In the Productivity tracker, both visualizations required similar tables:
projects on one dimension and earnings or hours on the other.
No participant used a pivot table for this.
The 2 that succeeded at this task used a hardcoded list of projects with SUMIF() to aggregate earnings and hours.
It is debatable whether this should be marked as a success, as it is not a generalizable solution.
In the spreadsheet condition, no participant was able to display a bar chart of average migraine intensity per month.
Grouping by month was particularly hard.
2/5 thought of creating a separate column but failed at doing so.
Averages by month were also hard: if they could not extract the month, they could not use AVERAGEIF() to calculate an average on it.
U5 said, I don’t think I could do that. I would not be able to do that. I’m already thinking how to do that in a lifesheet, but in this case, I will give up.
.
The migraines per side pie chart was easier due to the lack of grouping and aggregation. Regardless, 2/5 participants failed. Of the 3 that succeeded only one understood how they achieved the right result, the other two simply tried different settings until they got the right result.
Participants had a significantly easier time with the Lifesheets charting interface, which is optimized for grouping tasks as a thin abstraction over .
All 5 were able to display a bar chart of average migraine intensity per month, in a median of 34s.
4/5 were able to display a pie chart of migraines per side in a median time of 24s, although they hesitated before grouping by a non-temporal factor.
The one that couldn’t, U8, had created two separate toggles for the migraine side: left and right.
Creating the chart is possible with this design but requires a hidden expression to return a single value (e.g. if(left and right, ’both’, if(left, ’left’, ’right’)) or if(left, ’L’) & if(right, ’R’) to avoid conditional nesting which novices find hard [41]) , and as discussed above participants have trouble with adding hidden auxiliary data.
All participants were able to display a table of total earnings per project, and unlike spreadsheets, the list of projects reactively updated with the data.
None had a separate field for hours worked, so 2/5 failed at the subsequent task of displaying a pie chart of total hours per project.
As discussed earlier, it felt far more natural to programmers to create a hidden auxiliary field than to non-programmers. Both participants that failed were in the non-programmer group, and all three that created a hidden hours field had programming experience.
Participant responses to the charting interface ranged from positive to enthusiastic. U9 during the bar chart task: “Out of the things you have going on here, the charting is remarkable. I just created this bar chart with zero effort and you saw how much I struggled in Google Sheets.”. And then during the next pie chart task: “I thought I have no freaking idea how to do that, and then it was just right there!” U10: “Lifesheets made creating charts A LOT easier than Google Sheets. It makes a lot of assumptions for me that I don’t have to manually tell it.”
9.8.6Actions
There was only one action task: A button to end the last migraine in the Migraine condition.
In Lifesheets, this involved constructing an action to set end_time to time($now) for the last entry.
There was no control for this since spreadsheets do not support a similar feature (except via script).
All 5 participants understood what actions are and how to specify one and 4/5 succeeded on this task.
The one who failed (U8) selected the correct action type (Set) but could not figure out how to specify the current time
(used $now instead of time($now)),
which is quite a natural syntax that we should support.
All proceeded to use this button in the subsequent data entry task (ML7), which made this task far faster than the same data entry task in the control condition (MS7) (median of 18s vs 54s).
9.8.7Overall Impressions
9.8.7.1Ease of Creating Tracking Applications
The participants’ frustrations with spreadsheets permeated their SUS evaluation: They gave spreadsheet creation a median SUS score of 33.75 (x̅ = 36.25, σ = 21.3), which corresponds to an adjective rating between “Worst imaginable” and “Poor” according to [52]. In contrast, lifesheet creation got a median SUS score of 78.75 (x̅ = 75.75, σ = 10.3), far above the acceptability threshold of 67, and corresponding to an adjective rating between “Good” and “Excellent”.
U1 liked the temporal settings:
“Using spreadsheets to track something with dates and times is really hard, if I write dates it kind of works, but it’s weird. One of the core principles of lifesheets is that times and dates are at the core, you get a lot of power from how this works.”
U4 found the expression creation UI easier in Lifesheets:
“Oh a lot easier than using the spreadsheet, because I didn’t have to try and remember formulas. When you’re confronted with a spreadsheet you have to think about a lot, how to arrange columns, here it’s almost a drag & drop of what you want to do; a lot more intuitive.”
U8 found Formula² expressions and Lifesheet’s visual builder helpful:
“Expressions are super helpful. That’s the first step in getting something back from your data. The UI to create a sheet is really nice. It basically works around everything that I was just struggling with Google Sheets and the calculations I was trying to do. […] Very easy, can’t compare to the spreadsheet, it’s a breeze.”
9.8.7.2User Satisfaction
Participants rated using a lifesheet far more pleasant than a spreadsheet. On a scale of 1 (Very pleasant) to 5 (Very unpleasant), they rated using a spreadsheet x̅ = 3.6 and the lifesheet x̅ = 1.8.
Spreadsheet usage got a median SUS [17, 52] score of 51.25 (x̅ = 50.5, σ = 23.8), which corresponds to an adjective rating of slightly below “OK”. Lifesheet usage got a median SUS score of 90 (x̅ = 87.25, σ = 9.4), which corresponds to an adjective rating between “Excellent” and “Best imaginable”.
U3 remarked on the efficiency of the data entry interface: “Easier and more structured. Even this little “Add” button, it feels like adding things, like adding a new row to a spreadsheet. The interface is much friendlier than a Google sheet.” U4 said that they preferred the visual presentation of a lifesheet: “The spreadsheet looks sterile, this is more visual. My current tracking is a blackboard on my fridge. I respond to things more visual.” U5 also liked the more structured data entry interface of a lifesheet, as well as the fact that it works well on a phone: “working with data in spreadsheets feels horrible, working with the lifesheet was way better. […] Lifesheets is more structured, the way you work with datetimes is way better. Super cool that it works with your phone as well.” U6 liked actions and also mentioned mobile friendliness: “Definitely easier than spreadsheets. The customizable buttons to add entries and create shortcuts, that’s definitely an improvement over spreadsheets. Ease of entry is a big one. All the data and the visualization, it’s great, easier, but the deciding factor is that I can’t enter stuff into a spreadsheet when I’m in the middle of doing something.” U7 also mentioned the structured data entry, and also the charts: “Having it automatically put together something that has this summary view at the top. With spreadsheets it’s not organized the same way, maybe it can be but it requires more effort. This is a simpler view, with spreadsheets it’s hard to tell where to look. Spreadsheets have this nature of sometimes there are things this way, or that way, and you don’t know where to scroll. It can be difficult to do a handoff. As a manager I don’t want to spend too much time figuring out where everything is, there’s a lot of importance to that. I have a lot of challenges with spreadsheets, this guides people more, ‘that’s it, don’t worry about the rest’.” U9—the participant that tracked the most things out of everyone else in the study—spontaneously made Lifesheets his #1 bookmark during his session and remarked on customizability and portability “Better than other data trackers because it’s so customizable. A huge benefit of what you’re doing is that it’s on my computer. You’re one step ahead of things like Bearable [24] in that regard.”
9.8.7.3Likelihood of Lifesheet Usage over Alternatives
All participants said they were more likely to use a lifesheet over a spreadsheet for tracking (6/88The question was added after the first 2 sessions much more likely, 2/8 slightly more likely). 5/7 participants even said they would be more likely to use a lifesheet over a widely available app for the same purpose! (3/7 much more likely)
9.8.7.4Privacy, Data Ownership, and Portability
Several participants (U1, U5, U10) expressed privacy and data ownership concerns about using existing widely available tracking applications, consistent with one of the main barriers identified in the literature [2, 4–7].
“Sharing data with a random number of companies makes me uncomfortable.” — U5
Consequently, participants liked that the data Lifesheets records are stored in their own space of their choosing, rather than the servers of a commercial application. Those who could program additionally remarked on data portability:
“I like that it stores the data on GitHub where I could use it on other projects. Also like that it saves history on GitHub.” — U3
U10, a professional programmer, said that for certain use cases, any data stored on any server is not private enough:
“Biggest concern I have with these apps is privacy, even in a private repo. Some trackers are so private I wouldn’t even want on GitHub. In the tracker I have built, the data is local and encrypted. Some use cases I wouldn’t use lifesheets for because the data is ultra private. But the majority of my trackers could probably fit here.” — U10
Motivated by their comments, we added support for optionally storing data locally in the browser, rather than a cloud service. Madata already supported this, all that was needed was to expose it in the GUI.
9.8.8In the Wild
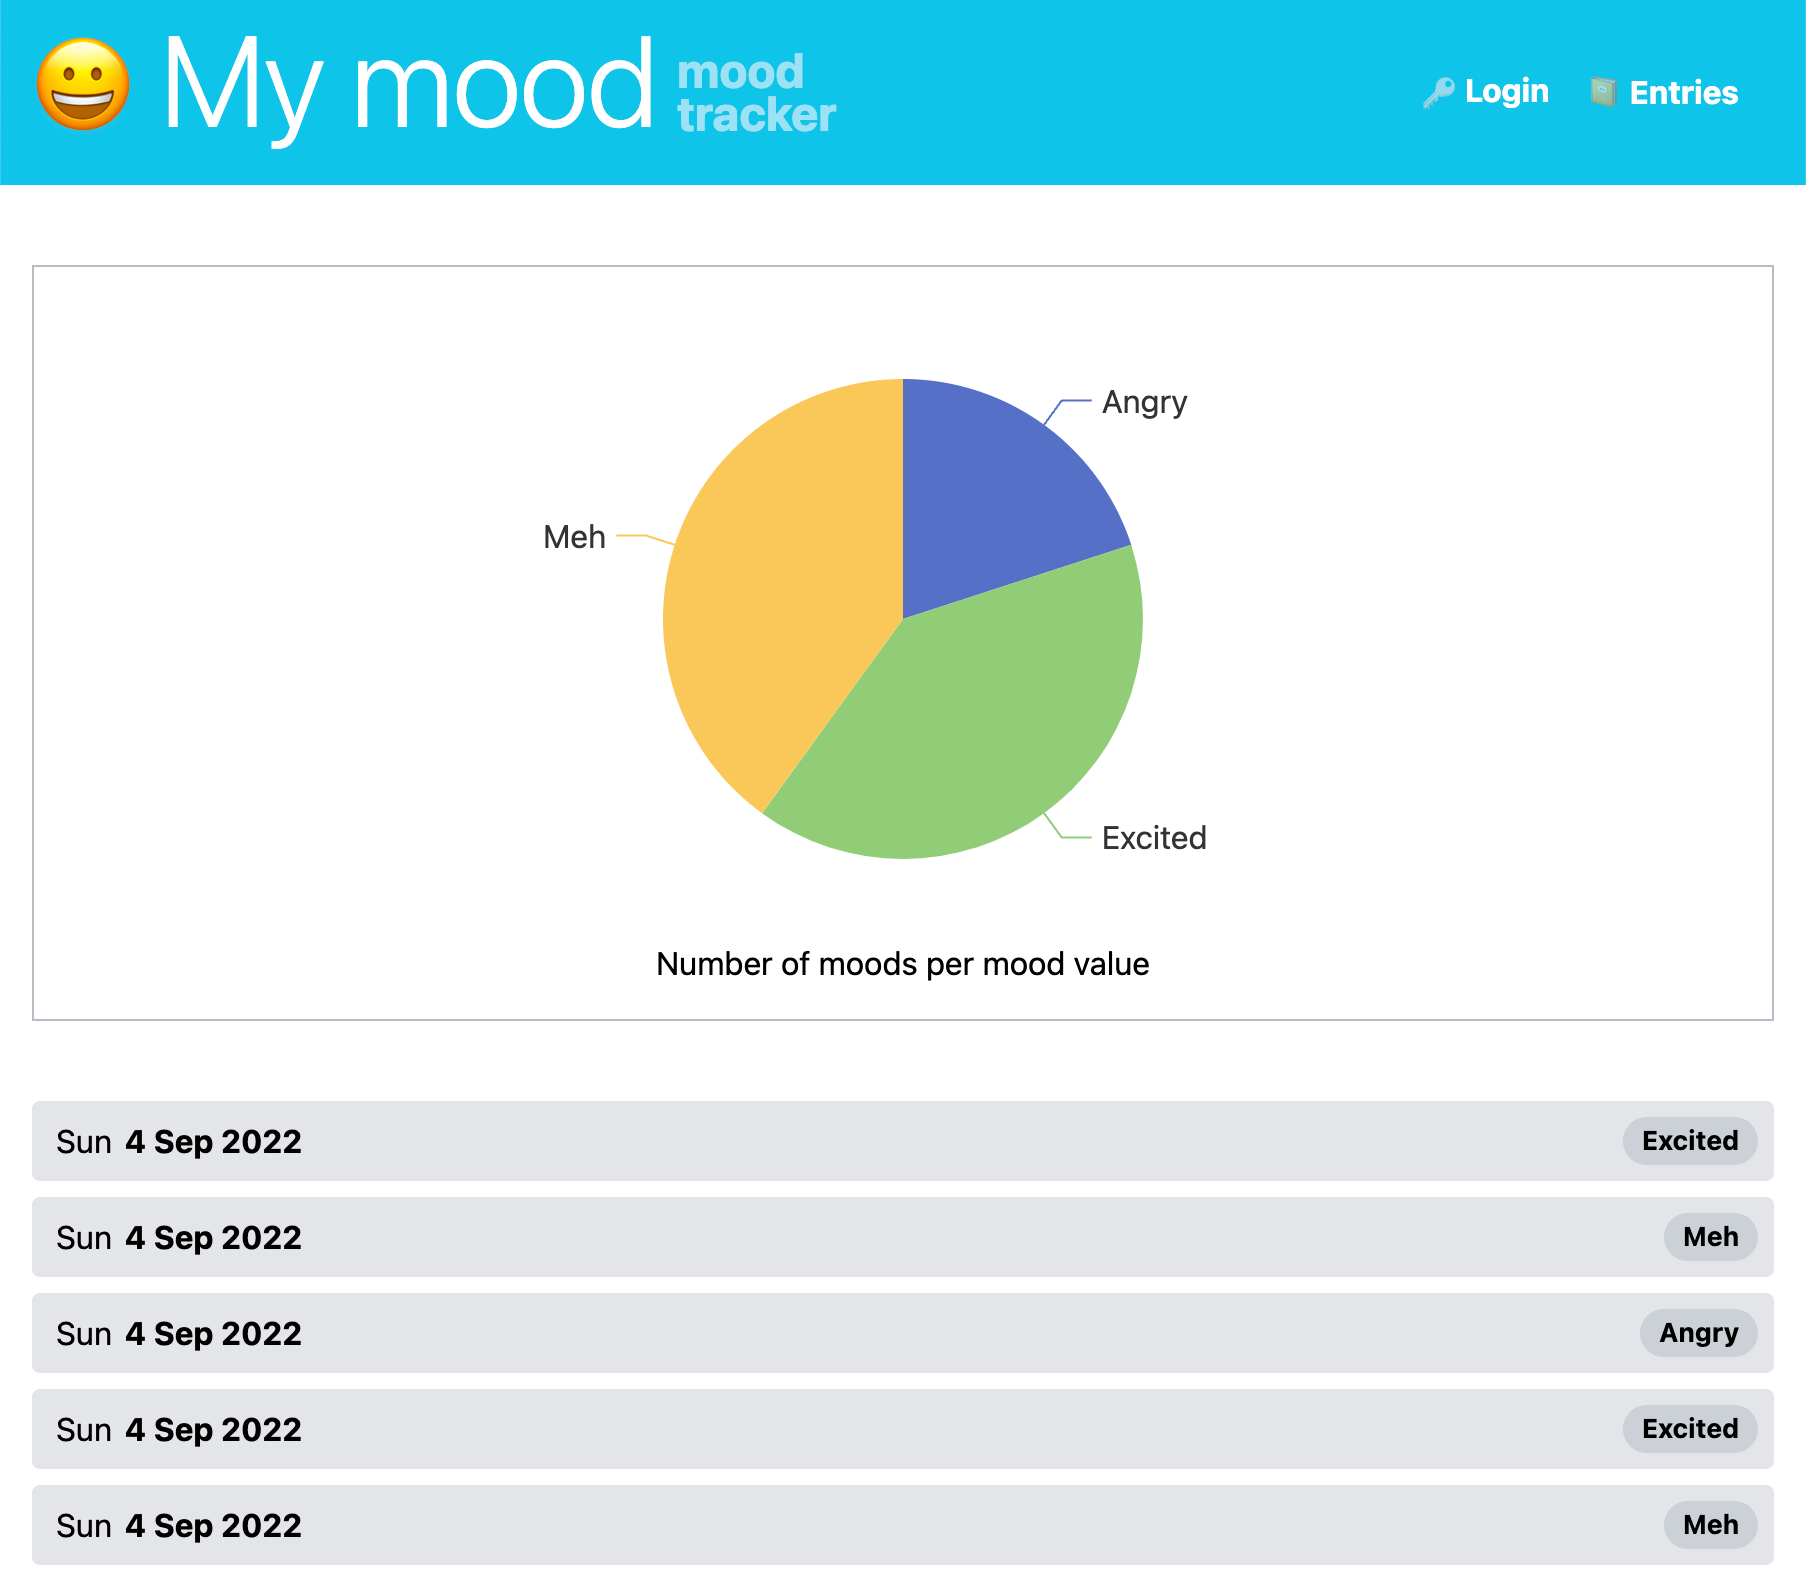
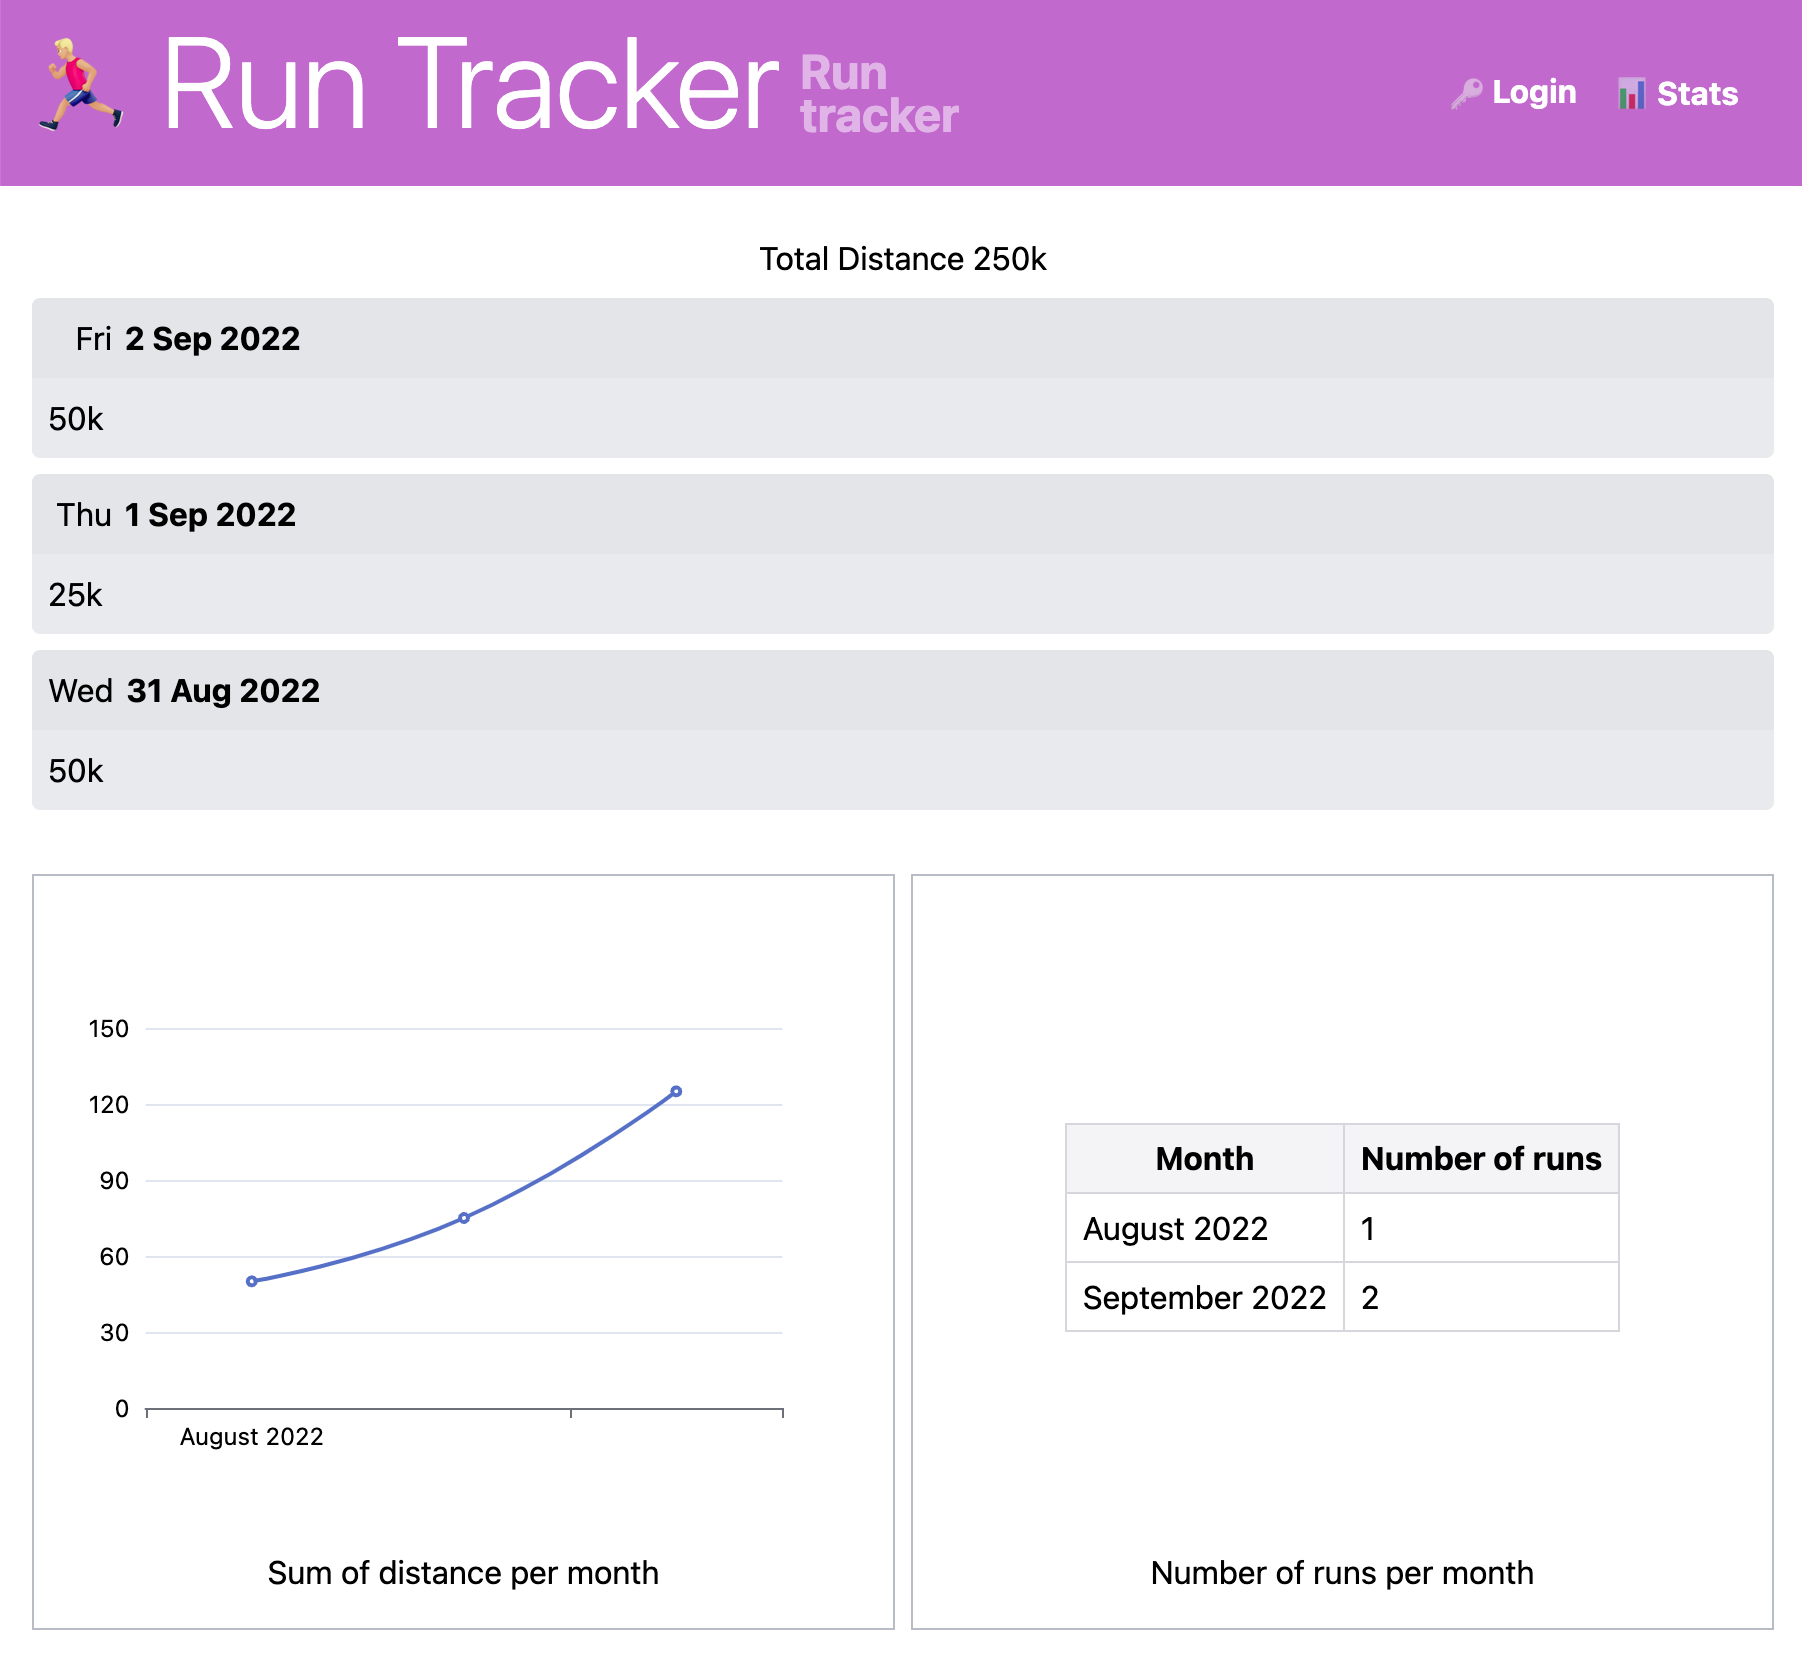
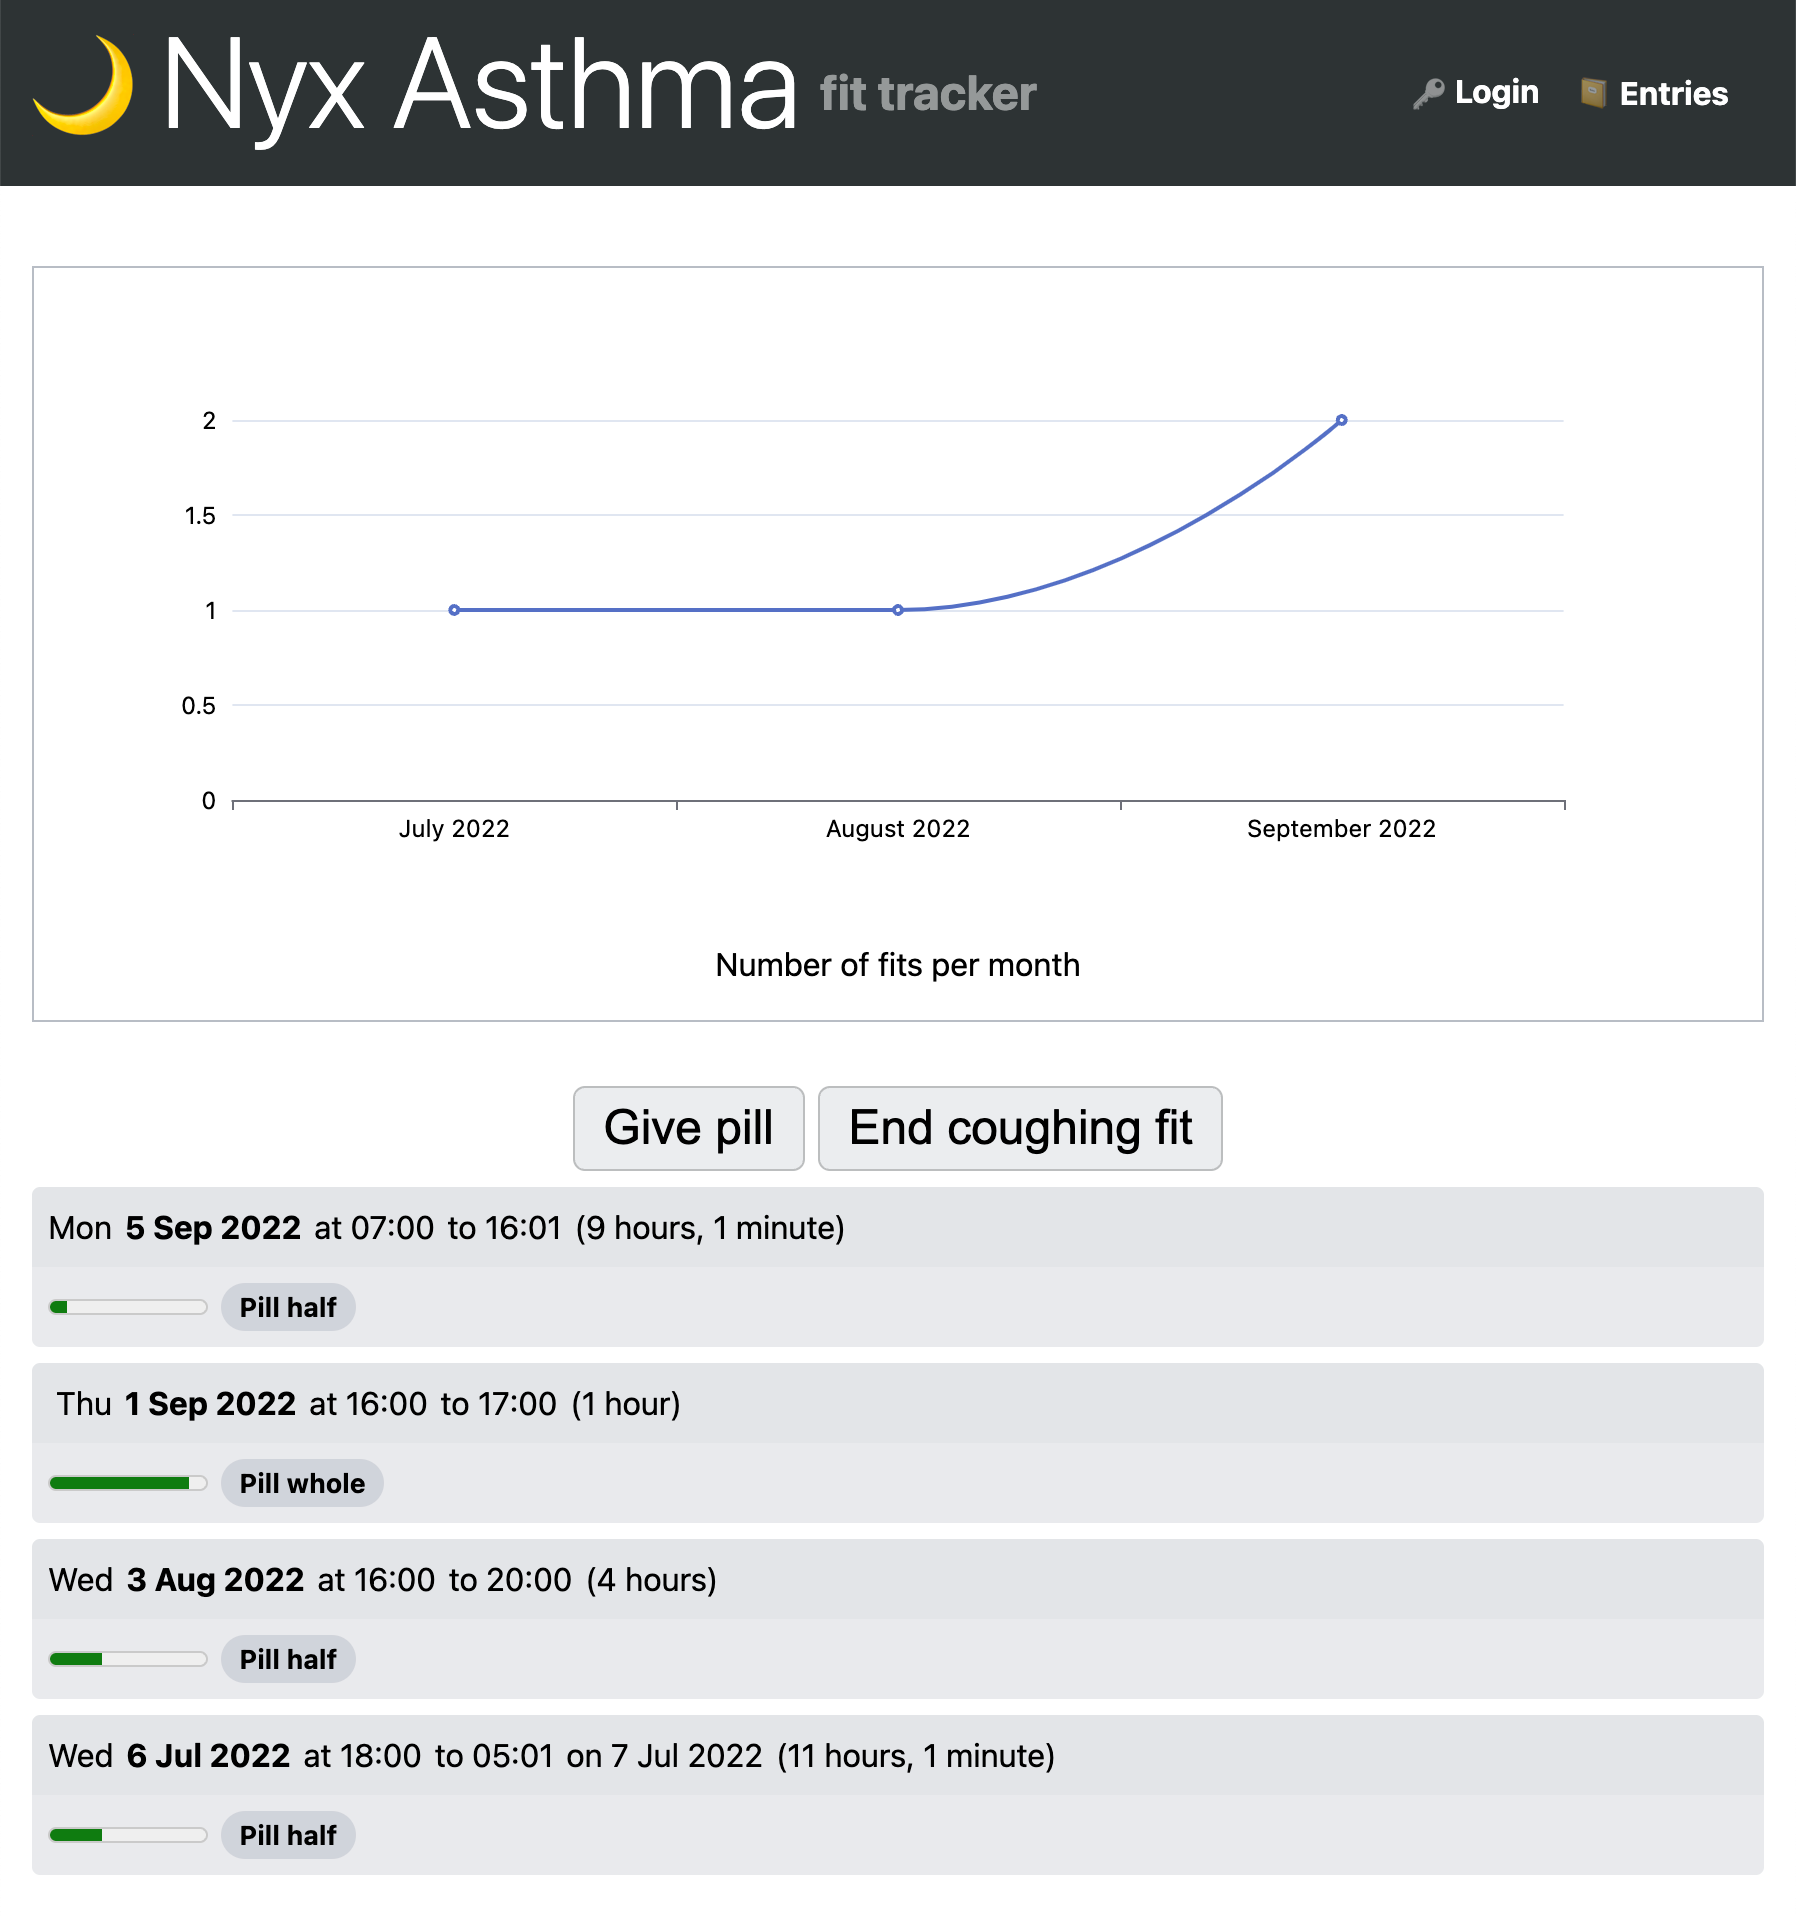
4/10 participants (U1, U2, U3, U4) had time to create a custom tracking application at the end of their session. They created: two mood trackers, a run tracker, and a tracker for cat asthma attacks. Three are shown in Figure 9.13 (the run tracker not shown is a simpler version of the one shown).
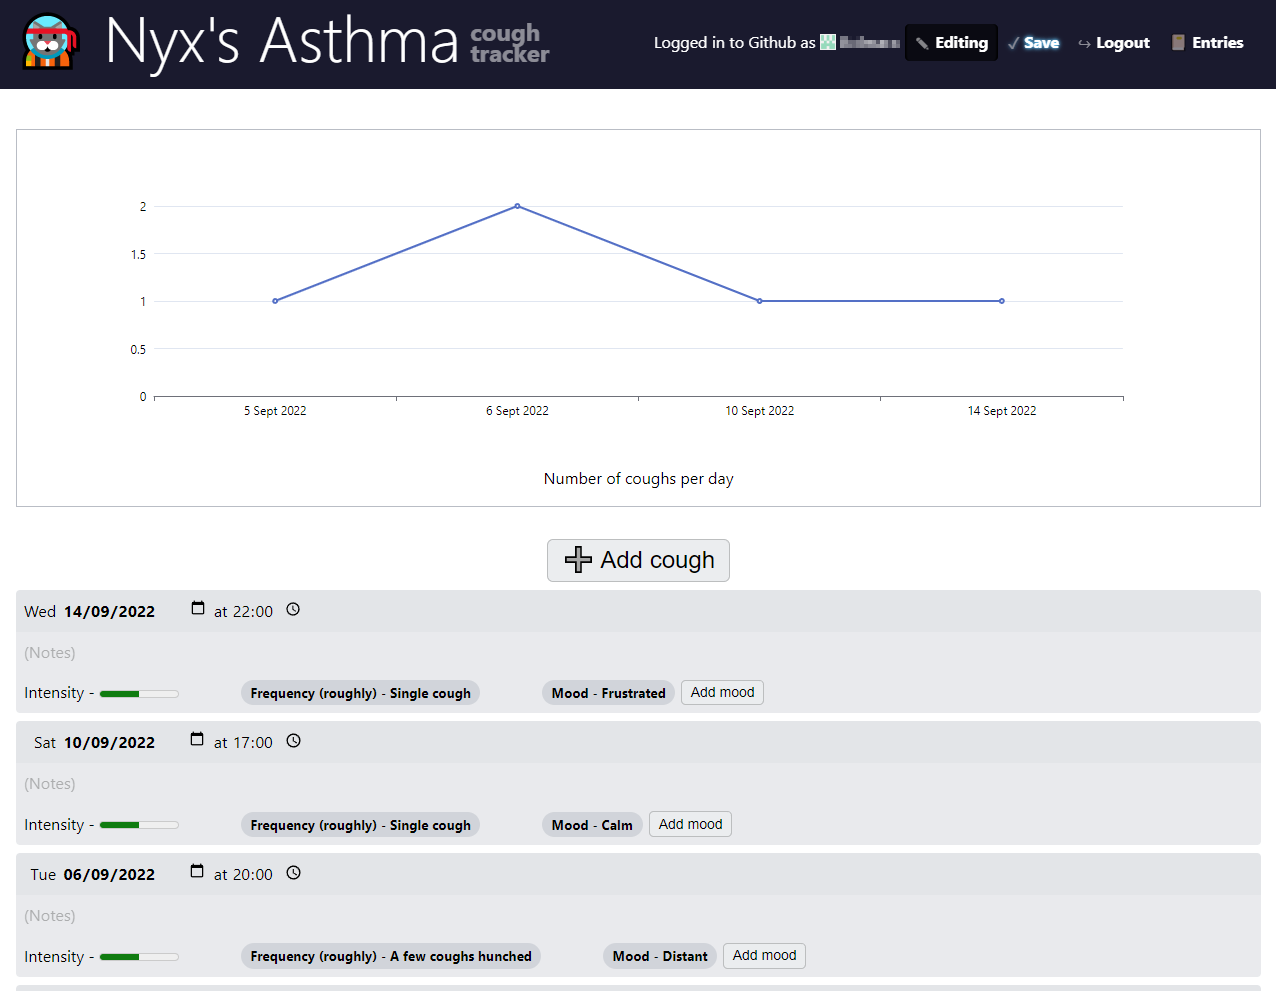
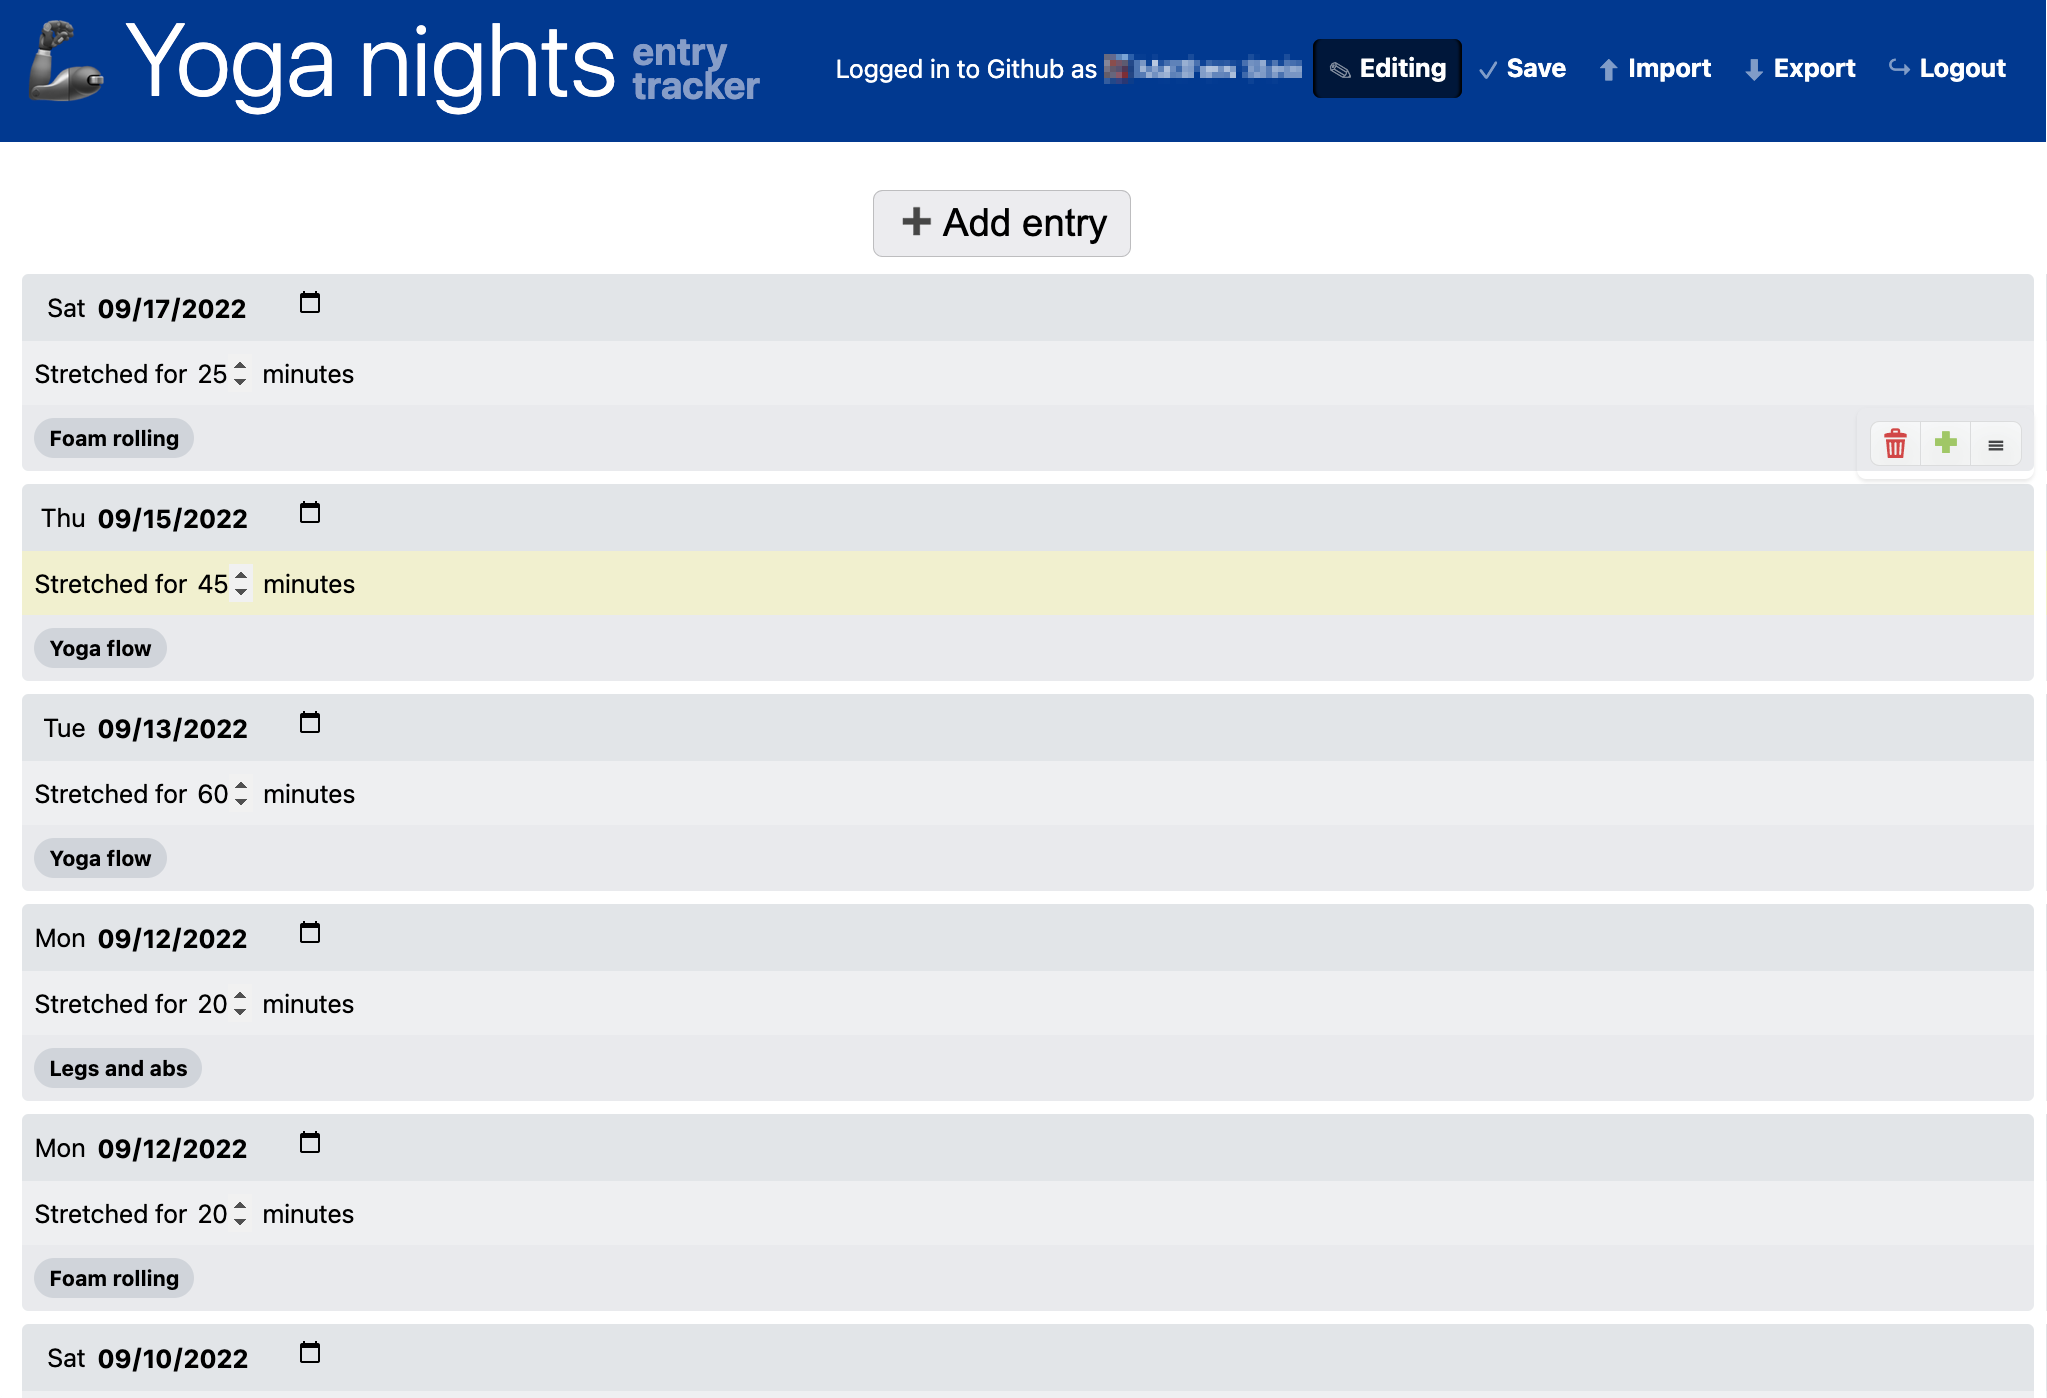
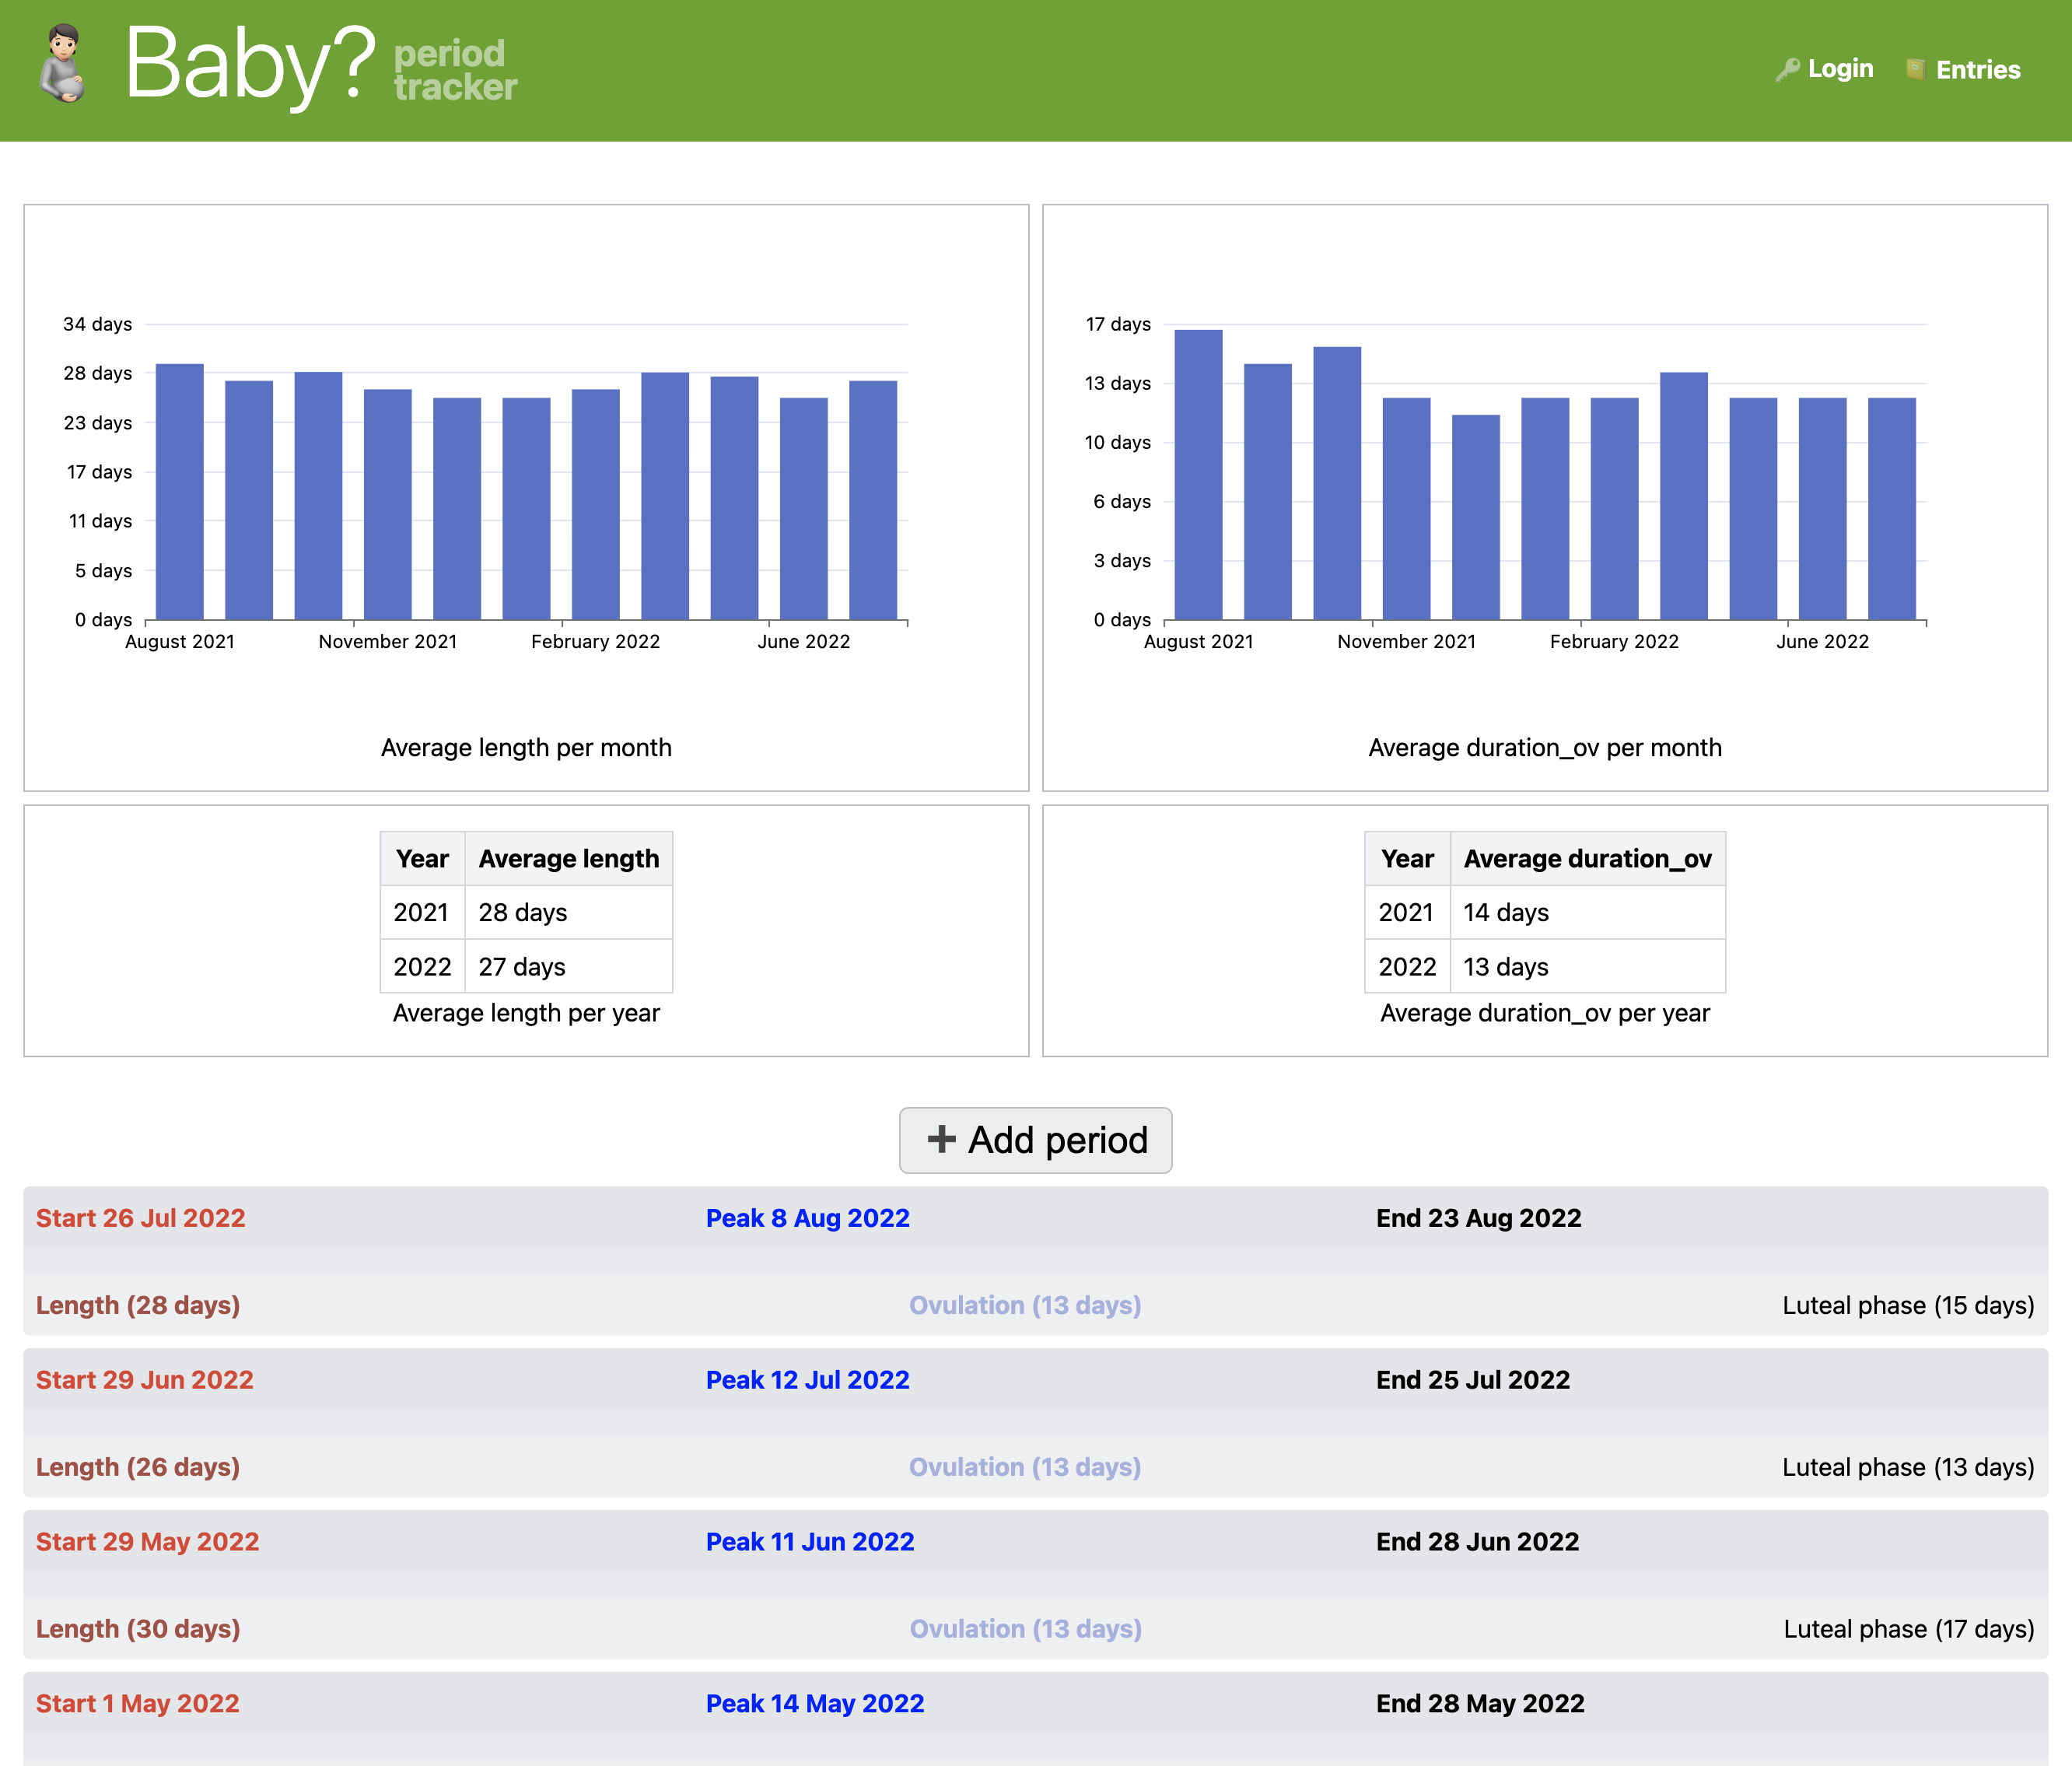
U4, U6, and U7 voluntarily spent time using Lifesheets on the days following the study (Figure 9.14). Interestingly, all were in the non-programmer group, indicating that perhaps even though non-programmers struggle more, they also perceive more value in a system like Lifesheets. U4 created an improved version of their cat asthma tracker with more granular data. U6 created a tracker for their stretching sessions and used it over a period of two weeks to track data until they realized they did not want to use a phone at all during these sessions. U7 created two trackers: a period & ovulation combination tracker and an app to track aspects of the manufacturing process in their materials engineering startup, to replace a legacy system. They preferred that we not screenshot the manufacturing tracker. They stopped using Lifesheets because they ran into bugs (they did not provide further details).
9.8.8.1Longitudinal Follow-up Case Study
U4 used Lifesheets regularly for five months after the study. We interviewed them again seven months after their original user study session. They had continued to evolve their cat asthma tracker (Figure 9.15) and used it to track data until it was no longer medically relevant. They had placed a shortcut to this lifesheet on their browser’s bookmark bar and said they recorded data immediately or at most a few minutes later. They shared this lifesheet with their veterinarian, who found it helpful. They mostly used it on their desktop computer, but also entered data through their phone if late at night.
Before Lifesheets, they were recording this data on a fridge blackboard and their phone’s notetaking application. They felt that using a lifesheet improved both the rate and granularity with which they collected data (they estimated 1/15 missed entries with Lifesheets vs 3-4/15 with their previous methods). They were motivated enough that they manually ported all their older data to their lifesheet.
When asked about the reasons they preferred a lifesheet over a spreadsheet, they remarked on the efficiency of tracking data, its visual appearance (spreadsheets feel needlessly complicated and clunky
),
and customization (this feels like something I made
).
They also felt adding a field to a lifesheet required less commitment,
whereas in a spreadsheet it would require a whole new column I have to scroll past
.
At the time of the interview, they also said there were several more lifesheets they plan to create: a mood tracker, a back pain tracker, and a chore tracker. In addition to their own use cases, they talked about Lifesheets to many of their friends, and even made a prototype of a pain tracker for a close friend (Figure 9.15).
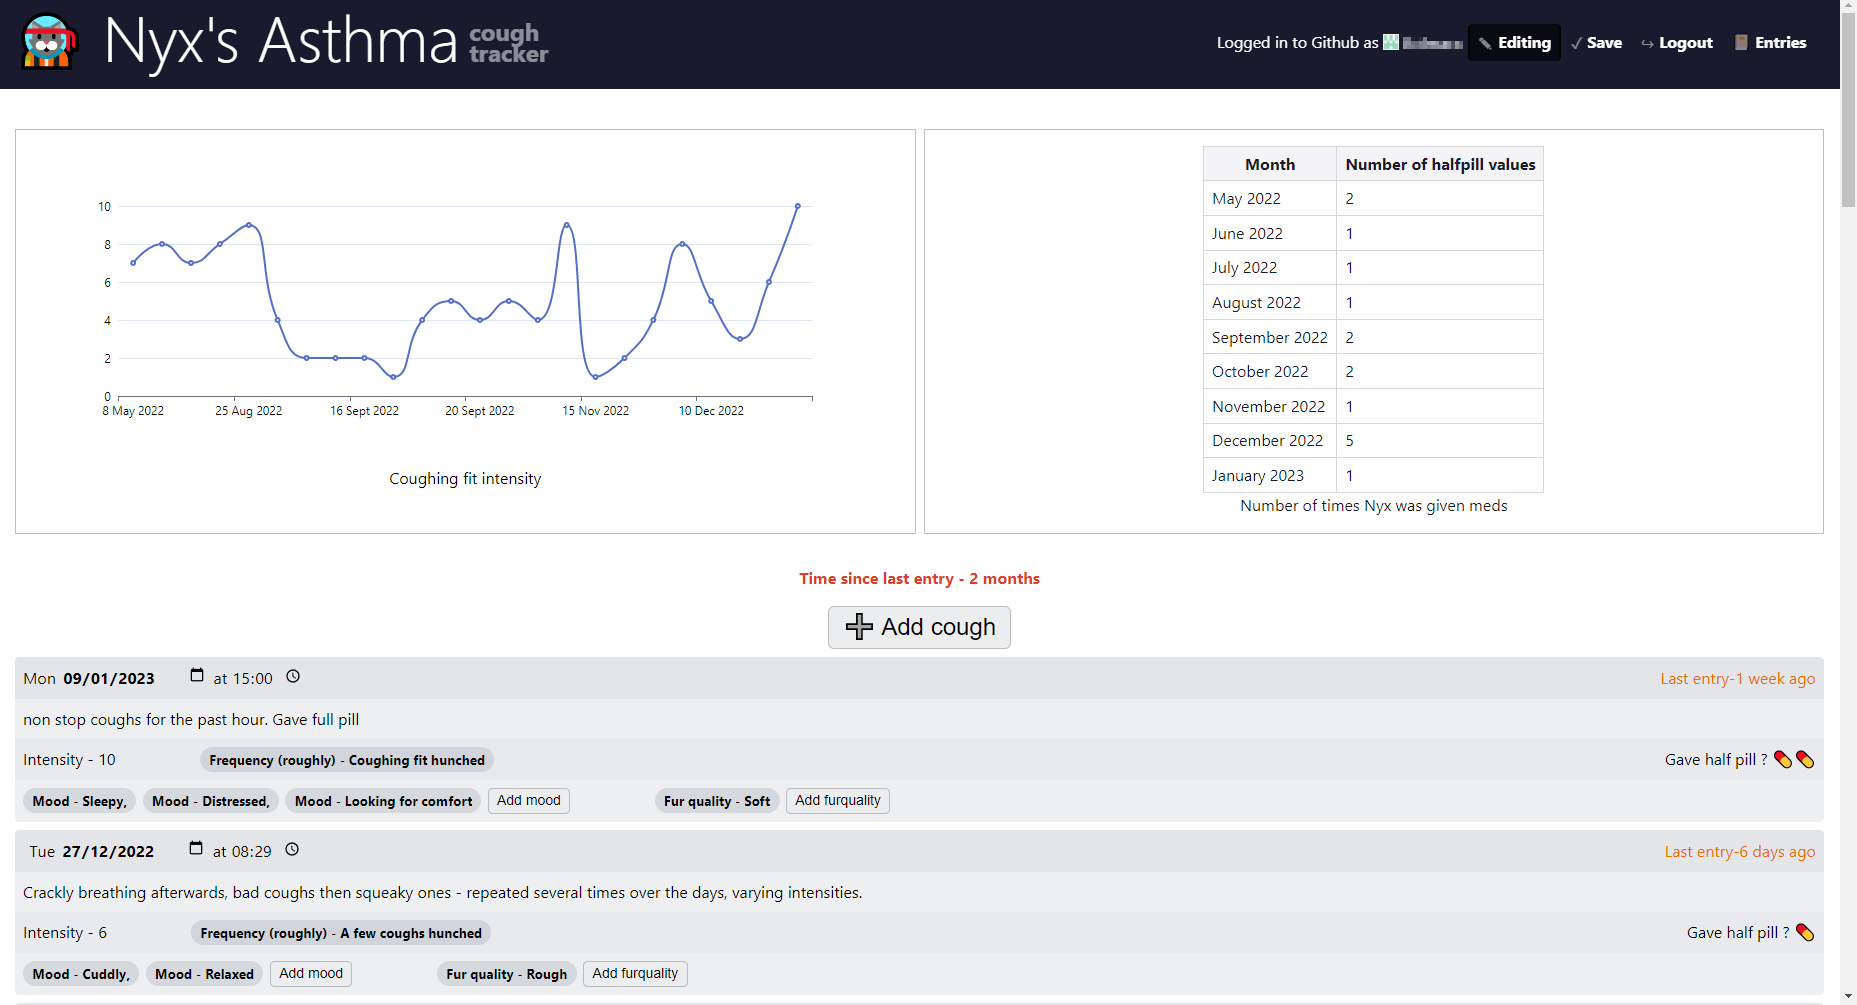
9.9Future Work
9.9.1Templates and “forking”
While Lifesheets simplifies application building, there is still a learning curve. To fully embrace tinkerability [47, 48] it would be useful to provide starting templates for common use cases that a user could customize instead of starting from scratch. It is already possible to visit another user’s profile and “fork” their public lifesheets, but there is no discovery mechanism for other users. Perhaps there could be a “featured” users or lifesheets section to facilitate. Note that it is also possible to “fork” an existing public lifesheet by opening it in the editor and sharing the URL. This is not exposed in the UI though U6 and U7 discovered it by experimentation.
9.9.2Autosave and Visible Edit History
Several participants mentioned that clicking Save felt foreign, as most modern applications autosave. The main reason Lifesheets require explicit saving is that data is saved in a remote version controlled system (GitHub) and every save creates a history entry (commit). We wanted to avoid polluting that history with too many entries, so that it’s usable for data recovery, as we plan to expose that history in the UI. Reasonable compromises could be: configurable autosave, persisting data locally until saved remotely, and/or coalescing minor consecutive edits into one history entry.
9.9.3Reminders
4/10 user study participants (U3, U6, U9, U10) mentioned reminders as the one missing piece for them to fully adopt Lifesheets. This was also a popular complaint about existing tools in the survey, and is a prevalent need in the literature. In line with its programmable philosophy, Lifesheets could support optional notifications with either static values or expressions This could easily be a setting on the Lifesheets editor so that users can opt-in and customize the kinds of reminders they would receive.
9.9.4Locations
Location is the only data entry type that was identified as common in [21] but Lifesheets does not yet support. An ideal implementation would support locations of various granularities (country, city, specific address, coordinates), as well as place names (e.g. specific restaurant). Suitable expression functions should be added to extract metadata from location properties (e.g. timezone, country, city, etc.), and suitable default values to automatically set from the current location.
9.9.5Timezones
While Lifesheets abstracts temporal math into a high level setting, there is one missing piece: timezones. Formula2 automatically takes timezones into account when specified, but currently, all tracking is presumed to happen within a single timezone. Date/time properties should support optionally specifying a timezone, with presets that read it from another Location property. This would also allow different start and end timezones, e.g. for travel.
9.9.6Correlations
A common motivation for tracking is to find correlations between different kinds of tracked data. [53–55]. This was also requested by U4 and U9. Visual correlations can be supported by allowing data from other lifesheets to be “mounted” to the current one, and plotting their data in the same chart. Going further, Lifesheets could even automatically detect correlations, without requiring any user hypothesis.
9.9.7Semi-automated Tracking
While Lifesheets works well for manual data entry, which—as discussed—has several benefits, semi-automated tracking [13], a combination of manual and automatic tracking, maintains these benefits but reduces the high data capture burden of manual tracking. It would be useful for lifesheets to be able to connect with external services and sync data, which could then be augmented further by the sheet. This was also requested by U4 and U9.
9.9.8Collaboration and Competition
Right now there are two levels of privacy: in public lifesheets everyone can read the data but only the author can edit, and in private ones only the author can read or edit data. In the user study, U10 asked “How do I share a private lifesheet with my wife?”. There is no way to share a private lifesheet with other users through the Lifesheets interface. Technical users can do so through GitHub, but since all lifesheets are currently stored in the same repository, this would share all of their private lifesheets. Lifesheets could address this by optionally storing lifesheets in separate repositories and providing UI for managing collaborators.
U9 suggested allowing users to “compete” on certain publicly tracked metrics (e.g. exercise), to encourage themselves to do better.
9.9.9Predicting Future Entries
For many tracking cases, predicting future occurrences is the primary motivation for tracking
(to find patterns in the data and get insights
was the most popular reason for self-tracking in our survey).
Currently this can be done by encoding the prediction logic in expressions, but Lifesheets could provide a more sophisticated, high-level way out of the box.
9.10Conclusion
In this chapter, I presented Lifesheets, a domain-specific End-User Programming system for creating personal tracking applications with minimal technical skill. We discussed the results of our needfinding study, which looked into the tracking needs of 85 people. We evaluated Lifesheets through case studies and a lab study of 10 participants, who all rated Lifesheets as more usable than spreadsheets for application creation, data entry, and reflection. We believe that Lifesheets can empower individuals to achieve their goals of preserving the data that matters to them about themselves and their loved ones, reflecting on them, and reaching higher levels of self-knowledge. Beyond evaluating Lifesheets, the lab study provided several insights on the usability of Formula², the viability of the vision behind Madata, and the learnability of Mavo concepts like properties and expressions embeded in static content.
We refer to the system as Lifesheets (capitalized) and to the apps created by it as lifesheet(s) ↩︎
mayoclinic.org/diseases-conditions/diabetes/in-depth/blood-sugar/art-20046628 ↩︎
Can be generated with widgets ↩︎
Can mostly be generated with widgets, plus a little editing ↩︎
The question was added after the first 2 sessions ↩︎